
Eindhoven municipal GIS services (ArcGIS REST)
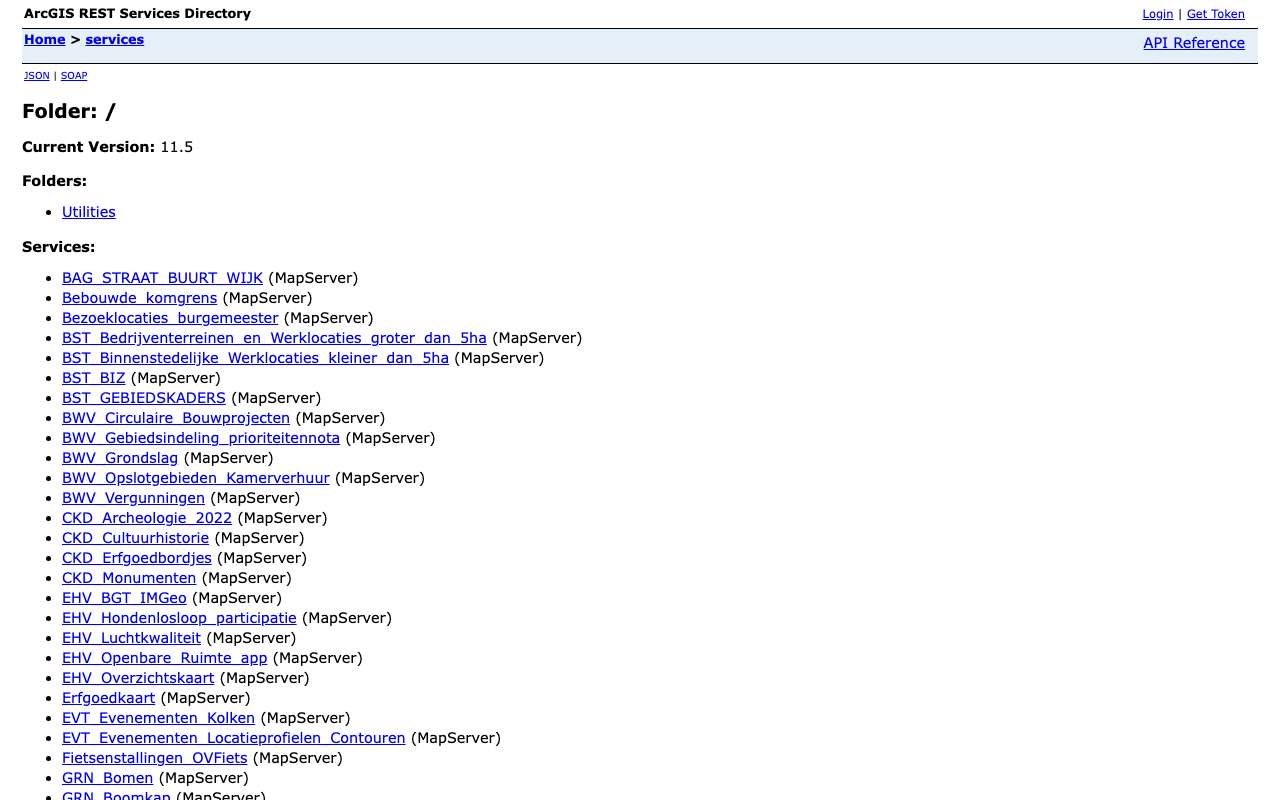
The ArcGIS server behind the City of Eindhoven's maps: 99 map services, with a department prefix in the name (GRN_ green, VKR_ traffic, ODS_ public space, WTR_ water …). On 16 October 2026 our index held 314 layers, including 128,070 trees with species and planting year, 1,105 public charging points and 390,723 public-space reports from 2021 to August 2024. Some of these layers also feed data.eindhoven.nl, but here you query each feature directly.
Everything that's in it314
All services and layers on this ArcGIS server, fetched every night. Every layer has its own page with fields, geometry and a query call.
Trees in Eindhoven's tree register by species: most zomereik (23,409 trees), then berk (Betula pendula) and gewone plataan
Trees in Eindhoven's tree register by species, oktober 2026, in trees. Total: 128,072; the largest 12 of 279 categories are shown. Zomereik is 18% of the total. Counted with one statistics query on the layer (field BOOMSOORT). 17,696 features have no value in this field.
What can you do with it?4 ideas
Which trees stand in your street?
GRN_Bomen has 128,070 trees with Dutch and Latin species name, height class and planting year. The pedunculate oak is by far the most common, with 23,409 trees; the oldest planting year above 1000 is 1820 (a plane tree). There are also wrong values, such as planting year 190.
Charging points per neighbourhood
VKR_Laadpalen (layer Openbare laadpalen) has 1,105 points with operator, number of connections and installation date. Count them per neighbourhood or per year of installation.
What do Eindhoven residents complain about?
LOM_MOR_Laatste_Jaren holds 390,723 public-space reports (2021 to 23 August 2024) with subject, neighbourhood and status. Illegal dumping is the largest subject with 115,545 reports, followed by street lighting (26,924).
Oak processionary moth in the city
The tree layer has fields on the oak processionary moth (present, stage, date found, control method). Combine with the oaks to see where the caterpillars return.
How to process it4 steps
Find the service
All 99 map services sit in the root. The prefix tells you which department maintains it; per service, ?f=json gives the layer id.
https://gisservice.eindhoven.nl/arcgis/rest/services?f=json
Trees around a point, as GeoJSON
Pass a rectangle in degrees (inSR=4326) and request output in degrees too (outSR=4326). The centre around the city hall yields 249 trees.
https://gisservice.eindhoven.nl/arcgis/rest/services/GRN_Bomen/MapServer/0/query?geometry=5.475,51.437,5.482,51.441&geometryType=esriGeometryEnvelope&inSR=4326&spatialRel=esriSpatialRelIntersects&outFields=BOOMSOORT_NEDERLANDS,PLANTJAAR,HOOGTE&outSR=4326&f=geojson
Count by species
With outStatistics and groupByFieldsForStatistics the server counts for you. The count field is called N in the response, even if you ask for n.
https://gisservice.eindhoven.nl/arcgis/rest/services/GRN_Bomen/MapServer/0/query?where=1%3D1&outStatistics=%5B%7B%22statisticType%22%3A%22count%22%2C%22onStatisticField%22%3A%22OBJECTID%22%2C%22outStatisticFieldName%22%3A%22n%22%7D%5D&groupByFieldsForStatistics=BOOMSOORT&orderByFields=n%20DESC&f=json
Page by 2,000
maxRecordCount is 2,000. For all trees, loop with resultOffset in steps of 2,000 (65 calls); only request the fields you need.
https://gisservice.eindhoven.nl/arcgis/rest/services/GRN_Bomen/MapServer/0/query?where=1%3D1&outFields=OBJECTID,BOOMSOORT,PLANTJAAR&orderByFields=OBJECTID&resultOffset=0&resultRecordCount=2000&outSR=4326&f=geojson
Interesting combinations

Trees per resident per neighbourhood
Count trees per CBS neighbourhood (by location) and divide by population from the neighbourhood key figures.

How tall are the trees really?
The tree layer gives a height class (e.g. 12-15 m). Compare with the AHN height at the same spot.
Similar sources
- Ddata.eindhoven.nl not in the index yet
The city's open data portal (Opendatasoft), with licence and downloads. Part of it is filled from this server (Openbaar groen, Plofgevoelig gebied).
 Amsterdam tree register
The Amsterdam tree register, through its own API with similar fields.
- Amsterdam public space reports
Public-space reports in Amsterdam, more current and with its own API.
What to watch out for
- Licence not established
The server says nothing about reuse. Eindhoven publishes on data.overheid.nl and data.eindhoven.nl mostly as public domain, but it is not stated for these layers.
- Firewall in front of the server
A web firewall (F5) sits in front: /robots.txt returns a 'Request Rejected' page. The REST directory itself is open; stop if you get that message and do not query too fast.
- Not everything is current
Layers carry no dates. The reports layer ends on 23 August 2024; 9,124 trees have no planting year or planting year 0.
- Own neighbourhood codes
BUURTCODE in the reports is the city's own neighbourhood number (e.g. 611), not the CBS code (BU0772…). Join on name or location.
APIArcGIS REST · read 16 Oct 2026
No key or token: the directory and all calls below worked anonymously. tested
leaf layers in 99 MapServers (306 unique names), plus 8 raster layers tested
jsongeojsonpbfpng (export, WMS)
Base URL
https://gisservice.eindhoven.nl/arcgis/rest/services
Endpoints 8
- GET
?f=jsonDirectory: version, folders and services (name + type). - GET
/{dienst}/MapServer?f=jsonService: layers and tables (id, name, group layer or not), maxRecordCount, capabilities, projection, description. - GET
/{dienst}/MapServer/{laag}?f=jsonLayer: fields (name, type, alias, length), geometry type, maxRecordCount, supportedQueryFormats and advancedQueryCapabilities (pagination, statistics, orderBy, distinct). - GET
/{dienst}/MapServer/{laag}/queryQuery features with a where clause or spatial filter; also count (returnCountOnly) and group (outStatistics). Response in JSON, GeoJSON or PBF. - GET
/{dienst}/MapServer/legend?f=jsonLegend per layer: labels and symbols (PNG as base64). - GET
/{dienst}/MapServer/export?bbox=…&bboxSR=4326&size=600,400&format=png&f=imageMap image as PNG for a rectangle; with f=json you get a link to the image. Without bbox: error 'bbox must be specified'. - GET
/{dienst}/MapServer/find?searchText=…&layers=0&searchFields=…&f=jsonSearch text in fields of one or more layers (partial match), returning the layer and the matched field. - GET
https://gisservice.eindhoven.nl/arcgis/services/{dienst}/MapServer/WMSServer?request=GetCapabilities&service=WMSWMS 1.3.0 of the same MapServer: path without /rest/ and with /WMSServer. Only for services whose supportedExtensions lists WMSServer.
Filtering platform
SQL-like where clause on the layer's fields, plus an optional spatial filter (geometry). Group and count with outStatistics.
Parameters 14
where | Condition in SQL-92 style: 1=1 for everything, text in single quotes (GEMEENTE='Zwolle'), LIKE with %, AND/OR, dates as DATE 'YYYY-MM-DD'. Required when there is no other filter. | tested |
outFields | Fields in the response, comma-separated, or * for all fields. | tested |
returnGeometry | false = attributes only (much smaller response). | tested |
outSR | Projection of the geometry in the response; 4326 = degrees (WGS84). Default is the layer's projection, here RD (28992). | tested |
f | Format: json (Esri JSON), geojson, pbf (protobuf), pjson (indented) or html (browse in the browser). | tested |
resultOffset | Pagination: number of features to skip (from 0). Use together with orderByFields for a stable order. | tested |
resultRecordCount | Maximum number of features in this response (capped at the layer's maxRecordCount). | tested |
orderByFields | Sort order, e.g. 'OBJECTID' or 'n DESC' (also on a statistics field). | tested |
returnCountOnly | true = only the number of features matching where: {"count": …}. | tested |
outStatistics | Server-side statistics: list of {statisticType, onStatisticField, outStatisticFieldName}; statisticType count, sum, min, max, avg, stddev or var. URL-encode it. | tested |
groupByFieldsForStatistics | Fields to group by with outStatistics (like GROUP BY). | tested |
returnDistinctValues | true with outFields and returnGeometry=false: the unique values of those fields. | tested |
geometry | Spatial filter: a point 'x,y' or envelope 'xmin,ymin,xmax,ymax', with geometryType (esriGeometryPoint, esriGeometryEnvelope), inSR (input projection), spatialRel (esriSpatialRelIntersects) and optionally distance + units (esriSRUnit_Meter) for a radius. | platform |
returnExtentOnly | true = only the bounding box of the matches (with outSR=4326 in degrees). | tested |
Fields of the example layer 10 · GRN_Bomen/MapServer/0 (128.070 bomen)
| Name | Type | Meaning |
|---|---|---|
OBJECTID | OID | Objectsleutel |
BOOMNUMMER | Double | Boomnummer van de gemeente |
BOOMSOORT | String | Wetenschappelijke naam (Quercus robur …); 17.708 keer leeg |
BOOMSOORT_NEDERLANDS | String | Nederlandse naam (Zomereik, Berk …) |
PLANTJAAR | SmallInteger | Plantjaar (let op uitschieters: minimum 190) |
HOOGTE | String | Hoogteklasse als tekst |
EIGENAAR | String | Eigenaar (BOR, Particulier, Begraafplaats …) |
BEHEERDER | String | Beheerder |
EPR_AANWEZIG | String | Eikenprocessierups aanwezig |
EPR_DATUM_CONSTATERING | Date | Datum waarop eikenprocessierups is vastgesteld |
Limits and pitfalls
- At most 2.000 features per response (the layer's maxRecordCount; varies per layer, see /{layer}?f=json). If there are more, the response has exceededTransferLimit: true: fetch the rest with resultOffset and resultRecordCount. tested
- No key and no documented rate limit. Take it easy (a few requests per second) and prefer statistics or counts over fetching all features. experience
- This server upper-cases statistics field names: outStatisticFieldName 'n' comes back as 'N', 'gem' as 'GEM'. Read the field case-insensitively. tested
- resultRecordCount is ignored with outStatistics (all groups are returned, 18 KB for BOOMSOORT_NEDERLANDS). tested
- find searches text fields on part of the value, but returns attributes as text ('OBJECTID': '71') and is capped at 2,000 results (searchText=Tilia: 1.8 MB). For counting, prefer query with LIKE: BOOMSOORT LIKE 'Tilia%' = 7,994. tested
- There is an F5 firewall in front of the server: /robots.txt returns a 'Request Rejected' page (HTTP 200). The REST API itself worked fine; if you get that page on an API call, stop. tested
- Service names start with a department prefix (GRN_ green, VKR_ traffic, BST_, EHV_, LOM_ …). Part of data.eindhoven.nl is fed from this server. experience
- Errors come back with HTTP 200 and a JSON object {"error": {"code": 400, …}} ('Failed to execute query.' for an unknown field in where). Always check for an error field, not just the status code. tested
- The server gives no modification date per service or layer (no editingInfo). How current a layer is, is not stated. tested
Try it HTTP 200 · 362 ms · 16 Oct
https://gisservice.eindhoven.nl/arcgis/rest/services/GRN_Bomen/MapServer/0/query?where=1%3D1&outStatistics=[{"statisticType"%3A"count"%2C"onStatisticField"%3A"OBJECTID"%2C"outStatisticFieldName"%3A"n"}]&groupByFieldsForStatistics=EIGENAAR&orderByFields=n DESC&f=json
{
  "displayFieldName": "",
  "fieldAliases": {
    "EIGENAAR": "EIGENAAR",
    "N": "N"
  },
  "fields": [
    {
      "name": "EIGENAAR",
      "type": "esriFieldTypeString",
      "alias": "EIGENAAR",
      "length": 50
    },
    {
      "name": "N",
      "type": "esriFieldTypeBigInteger",
      "alias": "N"
    }
  ],
  "features": [
    {
      "attributes": {
        "EIGENAAR": "BOR",
        "N": 108142
      }
    },
    {
      "attributes": {
        "EIGENAAR": "Particulier",
        "N": 11646
      }
    }
  ]
}
Shortened response, saved at harvest time. Click the URL for the real, current response.
Read from Directory: 99 MapServers in the root · Layer Boom (GRN_Bomen): fields · Esri: query operation (all parameters) · Esri: find operation. Labels: from the description stated in what the api itself publishes. tested from our own small call. platform applies to every api on this platform, per its documentation. experience learned while building open data index.
How to fetch it
curl "https://gisservice.eindhoven.nl/arcgis/rest/services/VKR_Laadpalen/MapServer/5/query?where=1%3D1&outFields=*&outSR=4326&f=geojson"
Used by
- data.eindhoven.nlThe city's open data portal, partly filled from this server
More from Eindhoven in our index
590 datasets in GIS-services Gemeente Eindhoven, dataportaal Eindhoven, data.overheid.nl. These changed most recently.
- Camera's openbare orde2026-10-31
- Camera's op kruispunten2026-10-31
- Real-time fijnstof monitoring2026-10-31
- Speciaal basisonderwijs2026-10-31
- Basisscholen2026-10-30
- Sportaccommodaties2026-10-30
More in this topic



See how this page is built
bron: gisservices-eindhoven
blokken: []
secties:
  - ideeen
  - verwerken
  - koppelingen
  - vergelijkbaar
  - beperkingen
  - code
  - gebruiktDoor
cache:
  tag: bron:gisservices-eindhoven
  ververs: na statuscheck, als de bron nieuwer is
statuscheck:
  methode: services-directory (?f=json) bereikbaar, aantal diensten als noot; de
    server geeft geen datums
  verwacht: jaarlijks
Source: content/bronnen/gisservices-eindhoven.yaml · Markdown