
Actueel Hoogtebestand Nederland (AHN, national elevation model)
The elevation map of the Netherlands, measured by laser from an aircraft: at least ten measurements per square metre. There are two maps. The terrain model (DTM) is the bare ground. The surface model (DSM) is everything on it, including buildings and trees. Via PDOK as a map layer (WMS), as a raster API (WCS) and as a download.
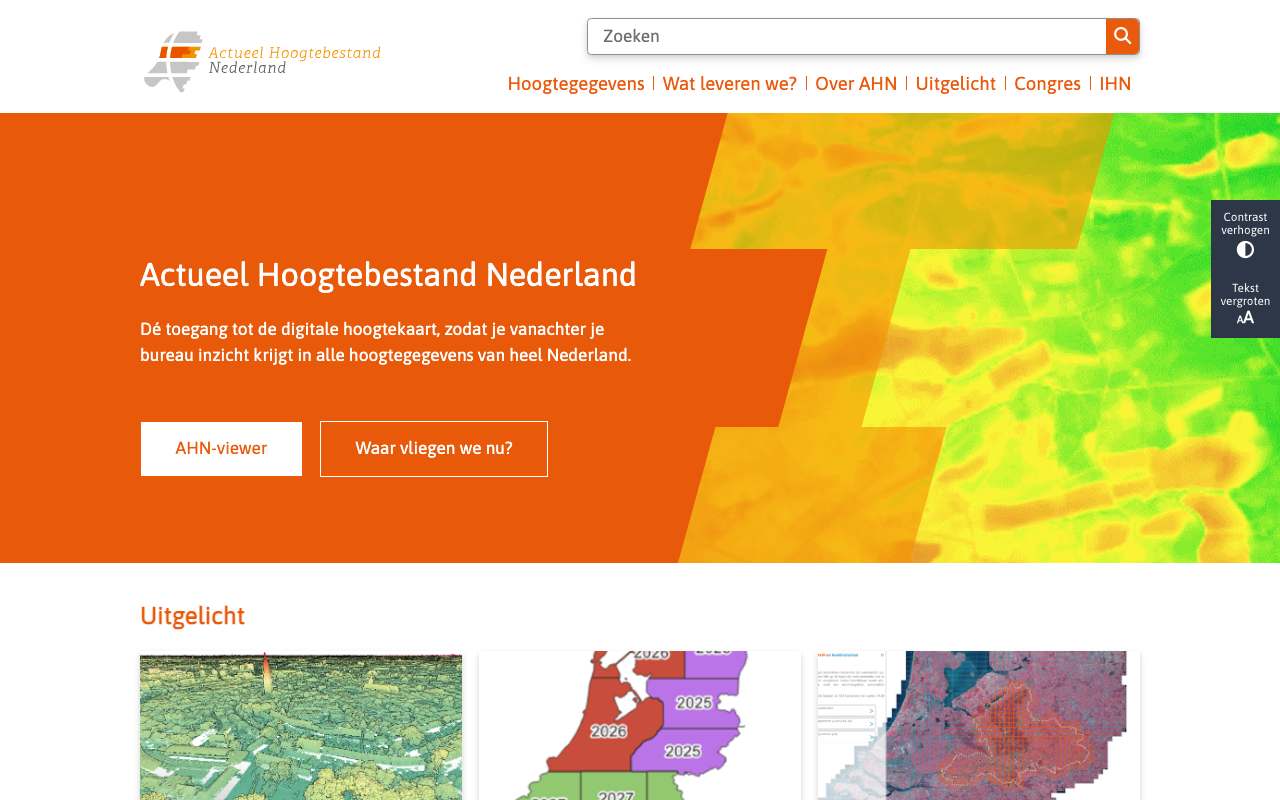
The relief of the hills around Valkenburg, from the Actueel Hoogtebestand Nederland
Ground level (DTM, 0.5 metre) from PDOK's AHN map service. According to the service's legend, yellow is low (20 to 35 metres above NAP), going through orange (40 to 90 metres) to red-orange (above 100 metres): the light ribbon is the Geul valley, the darker areas are the plateaus. The image comes straight from the service, so you see what the source delivers before downloading anything.
What you can build with it2
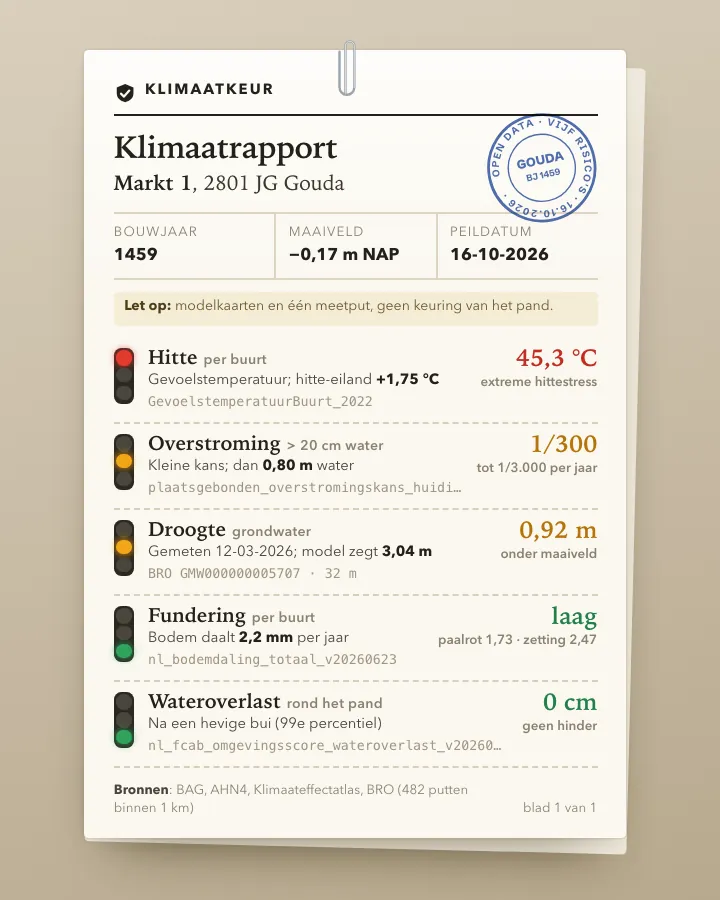 ToolClimate risk check for an addressType a postcode and house number and get one report on how the building fares on heat, flooding from rain, flooding from rivers and sea, drought and foundation problems, using the Klimaateffectatlas maps, the AHN elevation model, the BAG and real groundwater measurements from the BRO.4 sourcesAdvanced
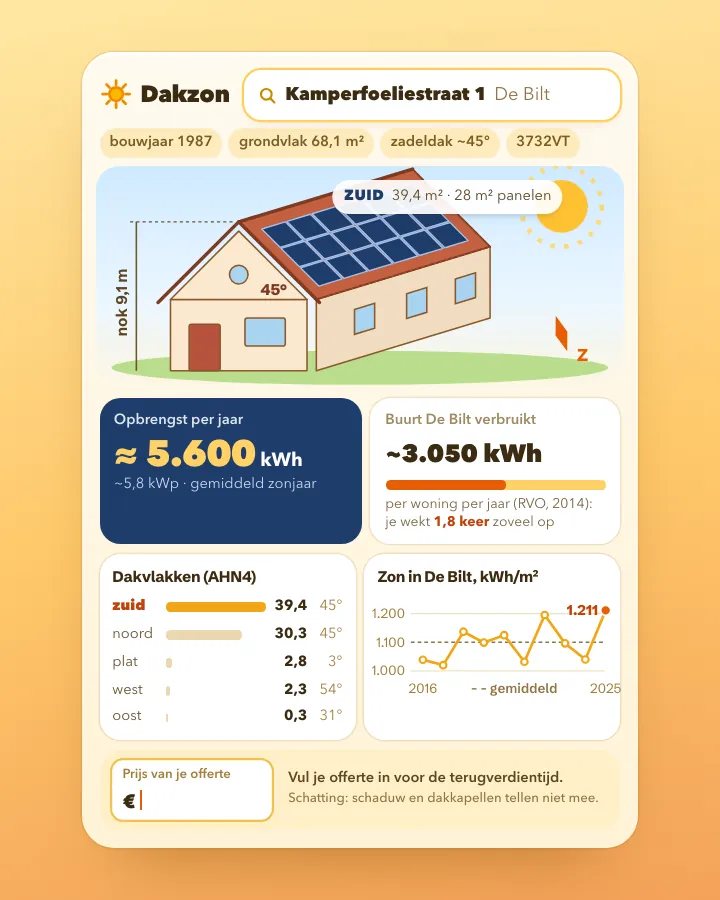 ToolSolar panel check for your own roofType a postcode and house number and see how large your roof surfaces are, which way they face, how much sun falls on them and roughly what panels would yield, using open data from BAG, AHN, KNMI and RVO.4 sourcesAdvanced
What can you do with it?4 ideas
How high is your street?
Request the elevation at one point from the terrain model. You get metres relative to NAP. Line up a set of addresses and you see which neighbourhood lies below sea level.
Measuring buildings without a tape
Subtract the ground from the surface (DSM minus DTM). What remains is the height of buildings, trees and bridges.
How much of the neighbourhood lies below NAP?
Clip the terrain model to the neighbourhood boundaries and count the share of cells below 0 metres per neighbourhood. Leave out buildings and water, they have no value in the DTM.
Is the ground sinking?
Compare two versions of the AHN at the same spot, for example in the peat meadow area. Note: since AHN5 the model is calculated differently, so preferably compare the new 1 by 1 kilometre tiles, which were re-derived for all versions.
How to process it4 steps
Elevation at one point
A WMS GetFeatureInfo on the dtm_05m layer returns the elevation in metres relative to NAP as JSON (value_list). Use RD coordinates. With a very small bbox (2 by 2 metres) we got an empty response; with 200 by 200 metres and the click in the centre it works.
https://service.pdok.nl/rws/ahn/wms/v1_0?service=WMS&version=1.3.0&request=GetFeatureInfo&layers=dtm_05m&query_layers=dtm_05m&styles=&crs=EPSG:28992&bbox=121300,487300,121500,487500&width=200&height=200&i=100&j=100&info_format=application/json
A small piece of raster
WCS GetCoverage cuts out a rectangle. 20 by 20 metres gives a GeoTIFF of 40 by 40 cells (float32, just over 3 KB). Choose dtm_05m or dsm_05m.
https://service.pdok.nl/rws/ahn/wcs/v1_0?service=WCS&version=2.0.1&request=GetCoverage&coverageId=dtm_05m&subset=x(121390,121410)&subset=y(487390,487410)&format=image/tiff
Large areas as map tiles
For more than a few hundred metres, download map tiles. PDOK's ATOM feed lists 1,373 tiles of 5 by 6.25 km as Cloud Optimized GeoTIFF; the largest are over 500 MB. Look up the tile number first with the kaartbladindex layer.
https://service.pdok.nl/rws/actueel-hoogtebestand-nederland/atom/dtm_05m.xml
Drop the empty cells
Cells without a measurement have the value 3.4 × 10³⁸ (the largest float32 number). In our test patch in the Oude Kerk area (Amsterdam) that was 813 of the 1,600 cells. Remove them before calculating averages.
Interesting combinations


How tall is every building in the area?
For each building from the BAG, take the highest or median DSM value and subtract the surrounding ground level.

Which neighbourhoods lie lowest?
Calculate the median ground level per neighbourhood. Use the same projection (EPSG:28992) for boundaries and raster.
Similar sources
- D3DBAG (TU Delft en 3DGI) not in the index yet
All buildings in 3D, derived from the BAG and the AHN. Easier if you only need building heights. CC BY 4.0.
- CDCopernicus DEM not in the index yet
Global surface model at 30 or 90 metres. Coarse, but consistent across borders.
 Climate Impact Atlas (Klimaateffectatlas)
Uses the AHN to calculate flood depth and waterlogging. Ready-made maps instead of raw elevation.
What to watch out for
- PDOK still has AHN4
The PDOK services contain AHN4, collected from 2020 to 2022 (ATOM feed updated 12 April 2023). The first part of AHN6 (north-east Netherlands, 2025) has been on ahn.nl since 13 October 2025, with its own WMS, WMTS and WCS services.
- Holes in the terrain model
Under buildings and on water the DTM has no value. If you need a continuous surface, fill the gaps yourself or use the DSM.
- Versions are not directly comparable
Up to AHN4 the DTM was a weighted average, and so was the DSM. Since AHN5 the DTM is an unweighted average and the DSM the highest point; since AHN6 without power lines and pylons. Differences between versions may therefore partly come from the method.
- Licence differs per version
AHN4 via PDOK is CC0. For AHN5 and AHN6 the publisher requires attribution (AHN6: CC BY 4.0).
- Really big
The whole country at 0.5 metres is 540,000 by 625,000 cells. Work with small extracts or tiles, never the whole country at once.
APIOGC WMS 1.3.0 + WCS 2.0.1 (PDOK) · read 16 Oct 2026
No key or account needed tested
DTM 0.5 m map tiles (5 × 6.25 km, Cloud Optimized GeoTIFF) in the ATOM feed; the grid is 540,000 × 625,000 cells tested
GeoTIFF (float32)pngjpegjson (GetFeatureInfo)COG (download)
Base URL
https://service.pdok.nl/rws/ahn
Endpoints 7
- GET
/wms/v1_0?service=WMS&request=GetCapabilitiesLayers dtm_05m (terrain), dsm_05m (surface) and kaartbladindex; 9 projections (incl. EPSG:28992, 3857, 4326). - GET
/wms/v1_0?service=WMS&version=1.3.0&request=GetMap&layers=dtm_05m&styles=&crs=EPSG:28992&bbox=…&width=…&height=…&format=image/pngMap image (coloured elevation) of a rectangle. - GET
/wms/v1_0?service=WMS&version=1.3.0&request=GetFeatureInfo&layers=dtm_05m&query_layers=dtm_05m&crs=EPSG:28992&bbox=…&width=200&height=200&i=100&j=100&info_format=application/jsonElevation at one point in metres relative to NAP (properties.value_list). - GET
/wcs/v1_0?service=WCS&request=GetCapabilities&version=2.0.1Coverages dtm_05m and dsm_05m; formats image/tiff, png, jpeg. - GET
/wcs/v1_0?service=WCS&version=2.0.1&request=DescribeCoverage&coverageId=dtm_05mExtent (RD 10000,306250 to 280000,618750) and grid (540,000 × 625,000 cells of 0.5 m). - GET
/wcs/v1_0?service=WCS&version=2.0.1&request=GetCoverage&coverageId=dtm_05m&subset=x(…)&subset=y(…)&format=image/tiffRaw elevation values as GeoTIFF (float32) for a rectangle in RD. - GET
https://service.pdok.nl/rws/actueel-hoogtebestand-nederland/atom/dtm_05m.xmlATOM feed with 1,373 map tiles (COG) and kaartbladindex.json (1.1 MB); also dsm_05m.xml.
The APIs of this source 1 · from the provider's documentation from the description
AHN6 en oudere versies via ahn.nl (Ellipsis Drive)
ahn.nl publishes every AHN version (AHN2 to AHN6) as WMS, WMTS and WCS at Ellipsis Drive, plus a tile index as WFS and OGC API Features. AHN6 DTM: 231a4c66-9de9-4f41-91af-e4e991df9160, AHN6 DSM: 22f5740b-1276-42e0-9d2d-dd2a9745e928. The WMS layer is named after an id, projections are EPSG:3857 and 28992. GetFeatureInfo with info_format=text/xml returned 'Gray:6.99399' in central Groningen. AHN6 is CC BY 4.0.
https://api.ellipsis-drive.com/v3/ogc- GET
/wms/231a4c66-9de9-4f41-91af-e4e991df9160?request=getCapabilitiesWMS van AHN6 DTM 0,5 m (laagnaam en projecties) - GET
/wms/231a4c66-9de9-4f41-91af-e4e991df9160?service=WMS&version=1.3.0&request=GetFeatureInfo&layers={laag-id}&query_layers={laag-id}&crs=EPSG:28992&bbox=…&width=200&height=200&i=100&j=100&info_format=text/xmlHoogte op een punt (antwoord als platte tekst 'Gray:<waarde>') - GET
/wcs/231a4c66-9de9-4f41-91af-e4e991df9160?request=getCapabilities&version=1.1.1WCS 1.1.1 van AHN6 DTM - GET
/wfs/0820faae-5240-499b-8486-cf406433cf71?request=getCapabilitiesKaartbladindex AHN6 als WFS (ook /features/… als OGC API)
Filtering tested
No query language: you pick a layer, a rectangle (bbox or subset) and optionally a pixel.
Parameters 6
layers / coverageId | dtm_05m = terrain (bare ground), dsm_05m = surface (with buildings and trees); WMS also has kaartbladindex. | tested |
crs / bbox | WMS: crs=EPSG:28992 with bbox=xmin,ymin,xmax,ymax in metres (RD). Also EPSG:3857, 4326, 4258, 25831, 25832, 3034, 3035, CRS:84. | tested |
i, j, width, height | GetFeatureInfo: the pixel within the image whose value you want. 200×200 px over 200×200 m with i=j=100 gives the centre. | tested |
info_format | application/json (GeoJSON with value_list), application/vnd.ogc.gml, text/xml … | tested |
subset | WCS: pass twice, subset=x(121390,121410)&subset=y(487390,487410), in RD metres. | tested |
format | WCS: image/tiff returns float32 values in metres; png and jpeg are images only. | tested |
Fields in the GetFeatureInfo response 3
| Name | Type | Meaning |
|---|---|---|
value_list | String · m | Hoogte in meters t.o.v. NAP, als tekst ('1.353800058') |
geometry.coordinates | Point | Middelpunt van de cel waaruit de waarde komt (RD) |
bbox | array | Zelfde punt als rechthoek |
Limits and pitfalls
- No key and no documented limit. Keep WCS cut-outs small (20 × 20 m = 3.4 KB); for large areas download the map tiles (up to over 500 MB per tile). tested
- PDOK has AHN4 (collected 2020–2022, ATOM updated 12 April 2023). Newer versions (AHN5, the first part of AHN6) are only on ahn.nl, via Ellipsis Drive (see components). tested
- With a very small bbox (2 × 2 m, 4 × 4 px) GetFeatureInfo returned an empty list; 200 × 200 m at 200 px with i=j=100 works. experience
- Cells without a measurement (buildings and water in the DTM) have the value 3.4028235e38 in the GeoTIFF. In 20 × 20 m of central Amsterdam that was 813 of 1,600 cells. Filter them out. experience
- There is no WFS and no WMTS at service.pdok.nl/rws/ahn (404). The tile index is a WMS layer and a JSON file in the ATOM feed. tested
- The same address also works as service.pdok.nl/rws/actueel-hoogtebestand-nederland/…; the ATOM feed is only under that long name. experience
Try it HTTP 200 · 394 ms · 16 Oct
https://service.pdok.nl/rws/ahn/wms/v1_0?service=WMS&version=1.3.0&request=GetFeatureInfo&layers=dtm_05m&query_layers=dtm_05m&styles=&crs=EPSG:28992&bbox=121300,487300,121500,487500&width=200&height=200&i=100&j=100&info_format=application/json
{
  "type": "FeatureCollection",
  "features": [
    {
      "type": "Feature",
      "bbox": [
        121398.75,
        487402.25
      ],
      "geometry": {
        "type": "Point",
        "coordinates": "…"
      },
      "properties": {
        "value_list": "1.353800058"
      }
    }
  ],
  "crs": {
    "properties": {
      "name": "urn:ogc:def:crs:EPSG::28992"
    },
    "type": "name"
  }
}
Shortened response, saved at harvest time. Click the URL for the real, current response.
Read from WMS capabilities: layers dtm_05m, dsm_05m, kaartbladindex · WCS capabilities: coverages, formats, projections · Extent and grid of dtm_05m · ATOM feed with the downloads (map tiles) · ahn.nl data room: all AHN versions with their WMS/WMTS/WCS at Ellipsis Drive. Labels: from the description stated in what the api itself publishes. tested from our own small call. platform applies to every api on this platform, per its documentation. experience learned while building open data index.
How to fetch it
curl "https://service.pdok.nl/rws/ahn/wms/v1_0?service=WMS&version=1.3.0&request=GetFeatureInfo&layers=dtm_05m&query_layers=dtm_05m&styles=&crs=EPSG:28992&bbox=121300,487300,121500,487500&width=200&height=200&i=100&j=100&info_format=application/json"
More from Het Waterschapshuis in our index
77 datasets in Nationaal Georegister, GBIF, datasets uit en over Nederland. These changed most recently.
- Actueel Hoogtebestand Nederland 2 (AHN2)2026-10-29
- MICA - Muskrat and coypu occurrences collected by UVW in the Netherlands2026-08-04
- Waterschappen Waterketen DAMO2026-07-31
- Coypu trapping data in the Netherlands 1992 – 2016, data at provincial level per year2026-06-06
- Muskrat trapping data in the Netherlands 1941 – 1986, data at provincial level per year2026-06-06
- Muskrat trapping data in the Netherlands 1941 – 1970, at municipal level per year2026-06-06
More in this topic


See how this page is built
bron: ahn
blokken: []
secties:
  - ideeen
  - verwerken
  - koppelingen
  - vergelijkbaar
  - beperkingen
  - code
cache:
  tag: bron:ahn
  ververs: na statuscheck, als de bron nieuwer is
statuscheck:
  methode: datum in de ATOM-feed van de PDOK-dienst (AHN4)
  verwacht: elke paar jaar
Source: content/bronnen/ahn.yaml · Markdown