Municipal budget explorer: what does my municipality spend money on?
Pick a municipality and see its budget per policy area, in euros per resident, and how one policy area compares with all 342 municipalities.
geef_project("gemeentebegroting-verkenner")geef_bron("iv3-gemeentefinancien")geef_bron("cbs-bevolking-maand")
I have the project, the tested calls and the pitfalls. I'll build a tool with Iv3, municipal budgets and accounts and Population change by month. This is how it could look:
You build this yourself. Copy the prompt into Claude, ChatGPT or Cursor, with the MCP server on, or follow the steps below.
This is a mockup, not a working version, with the figures from our test run on 16 October 2026 (budget 2026, CBS table 45078NED). Turn the MCP server on with the address on For AI.
Who it's for
Council members and their staff who want to understand the budget, local journalists, residents who want to know what their municipality spends on, and civil servants who want to compare themselves with similar municipalities.
What you get
An explorer where you pick a municipality and see the expenses in the budget per main policy area (administration, safety, traffic, education, social domain …), in millions and in euros per resident. Below that one policy area as a ranking of all municipalities, with the median and your municipality's position.
Test run on 16 October 2026 with the 2026 budget (CBS table 45078NED): Utrecht budgets 2,094.4 million euros in expenses, 5,539 euros per resident (378,121 residents on 1 January 2026). The social domain is the largest: 726.5 million, 1,921 euros per resident. For income schemes (policy area 6.3, mainly social assistance) Utrecht budgets 585 euros per resident: position 64 of 342, against a median of 353 euros. Amsterdam (1,123), Rotterdam (1,113) and The Hague (1,072) top the list, Rozendaal (95) is last.
Budgeted general grant from the Municipalities Fund per resident: highest in Schiermonnikoog (4,844 euros), lowest in Bloemendaal (1,481 euros)
Budgeted general grant from the Municipalities Fund per resident per municipality, begroting 2026, in euros per resident. Netherlands as a whole: 2,590. 342 municipalities with a figure.
How you could start5 steps
- 1
Find the newest annual table
Iv3 data live on dataderden.cbs.nl, one table per year and per type of government. The catalogue lists them all; the title names the year. On 16 October 2026, 45078NED (Municipalities 2026) was the newest, with the 2026 budget of all 342 municipalities.
https://dataderden.cbs.nl/ODataCatalog/Tables?$filter=Catalog eq 'IV3' and startswith(Title,'Gemeenten')&$select=Identifier,Title,Modified&$format=json
{"odata.metadata":"https://dataderden.cbs.nl/ODataCatalogDerden/$metadata#Tables&$select=Identifier,Title,Modified","value":[ {"Identifier":"45078NED","Title":"Gemeenten 2026 onbewerkte Iv3-data","Modified":"2026-08-31T02:00:00"}, {"Identifier":"45071NED","Title":"Gemeenten 2025 onbewerkte Iv3-data","Modified":"2026-09-22T02:00:00"}, {"Identifier":"45067NED","Title":"Gemeenten 2024 onbewerkte Iv3-data","Modified":"2025-09-22T02:00:00"}, … - 2
Fetch the expenses of one municipality, with padded keys
Four dimensions: Gemeenten, TaakveldBalanspost, Categorie and Verslagsoort. Keys are padded with spaces and the length differs: municipality 9 characters ('GM0344 '), policy area 6 ('6.3 '), category 8. Verslagsoort 2026X000 is the budget, 2026X005 the annual accounts. Categories starting with L are expenses, with B income. Amounts in 1,000 euros. Without the spaces you get an empty list, not an error.
https://dataderden.cbs.nl/ODataApi/OData/45078NED/TypedDataSet?$filter=Gemeenten eq 'GM0344 ' and Verslagsoort eq '2026X000' and TaakveldBalanspost eq '6.3 ' and startswith(Categorie,'L')&$format=json
{"odata.metadata":"https://dataderden.cbs.nl/ODataApi/OData/45078NED/$metadata#Cbs.OData.WebAPI.TypedDataSet","value":[ {"ID":6243870,"TaakveldBalanspost":"6.3 ","Categorie":"L1.1 ","Gemeenten":"GM0344 ","Verslagsoort":"2026X000","k_1ePlaatsing_1":0.0,"k_2ePlaatsing_2":0.0}, … {"ID":6260286,"TaakveldBalanspost":"6.3 ","Categorie":"L4.1.1 ","Gemeenten":"GM0344 ","Verslagsoort":"2026X000","k_1ePlaatsing_1":190551.0,"k_2ePlaatsing_2":190551.0}, … - 3
Stay under 10,000 rows
The table is a full cube: every combination is in it, also with 0. One policy area for all municipalities is 342 x 37 expense categories = 12,654 rows, and then the API refuses with HTTP 500 and a text message (not JSON). $skip does not work here ('only on the ODataFeed endpoint') and 'not' is ignored. So split by category: L4 alone gives 7,524 rows, L1, L2, L3, L5, L6 and L7 together 5,130.
https://dataderden.cbs.nl/ODataApi/OData/45078NED/TypedDataSet?$filter=TaakveldBalanspost eq '6.3 ' and Verslagsoort eq '2026X000' and startswith(Categorie,'L')&$format=json
Error getting TypedDataSet for '45078NED': The given query is not allowed on this table. Please redefine your query so that it returns less than 10000 records.
- 4
The same question in two parts
With $select you keep the response small. Add up the amounts of all expense categories per municipality; bookings differ per municipality, so never compare a single category.
https://dataderden.cbs.nl/ODataApi/OData/45078NED/TypedDataSet?$filter=TaakveldBalanspost eq '6.3 ' and Verslagsoort eq '2026X000' and startswith(Categorie,'L4')&$select=Gemeenten,Categorie,k_2ePlaatsing_2&$format=json
{"odata.metadata":"https://dataderden.cbs.nl/ODataApi/OData/45078NED/$metadata#Cbs.OData.WebAPI.TypedDataSet&$select=Gemeenten,Categorie,k_2ePlaatsing_2","value":[ {"Gemeenten":"GM1680 ","Categorie":"L4.1.1 ","k_2ePlaatsing_2":5909.0}, {"Gemeenten":"GM0358 ","Categorie":"L4.1.1 ","k_2ePlaatsing_2":6606.0}, … (7.524 rijen) - 5
Residents on 1 January as the denominator
CBS table 37230ned has the population per municipality per month. The new OData v4 on datasets.cbs.nl uses measure codes (M000098 = population at the start of the period) and keys without spaces ('GM0344'). Abolished municipalities are included with Value null; Value itself cannot be filtered, so filter in your code. Utrecht: 378,121 on 1 January 2026.
https://datasets.cbs.nl/odata/v1/CBS/37230ned/Observations?$filter=Perioden eq '2026MM01' and Measure eq 'M000098' and startswith(RegioS,'GM')&$select=RegioS,Value
{"@odata.context":"https://datasets.cbs.nl/odata/v1/CBS/37230ned/$metadata#Observations(RegioS,Value)","value":[
  {"Value":26062.0,"RegioS":"GM1680"},{"Value":null,"RegioS":"GM0738"},{"Value":33459.0,"RegioS":"GM0358"},
  {"Value":27608.0,"RegioS":"GM0197"},{"Value":null,"RegioS":"GM0480"}, …
How the sources fit together
- Iv3, municipal budgets and accountsPopulation change by monthvia
gemeentecode: Iv3 'GM0344 ' (9 tekens), OData v4 'GM0344', OData v3 37230ned 'GM0344'The same municipality code, but every table pads it differently: in Iv3 with spaces to 9 characters, in the district and neighbourhood key figures to 10, in 37230ned (v3 and v4) not at all. Strip spaces (trim) before joining. Use the population on 1 January of the budget year (Perioden '2026MM01').
Let AI build it
Paste this prompt into Claude, ChatGPT, Cursor or Lovable. It names the real endpoints, the join keys and the pitfalls, so the assistant writes working code straight away. Always check the result against the source itself.
Build a web app (React or a single HTML file with JavaScript) where I pick a municipality and see what it spends money on: expenses per main policy area, in millions and per resident, plus a ranking of all municipalities for one policy area I choose.

Data, no key:
1. Catalogue: https://dataderden.cbs.nl/ODataCatalog/Tables?$filter=Catalog eq 'IV3' and startswith(Title,'Gemeenten')&$format=json. Pick the table with the highest year in the title ('Gemeenten 2026 onbewerkte Iv3-data' = 45078NED).
2. Data: https://dataderden.cbs.nl/ODataApi/OData/45078NED/TypedDataSet?$filter=…&$select=Gemeenten,TaakveldBalanspost,Categorie,k_2ePlaatsing_2&$format=json
   Dimension lists with names: /Gemeenten, /TaakveldBalanspost, /Categorie, /Verslagsoort under the same base.
3. Residents: https://datasets.cbs.nl/odata/v1/CBS/37230ned/Observations?$filter=Perioden eq '2026MM01' and Measure eq 'M000098' and startswith(RegioS,'GM')&$select=RegioS,Value

What you need to know:
- Iv3 keys are padded with spaces and the length differs per dimension: Gemeenten 9 characters ('GM0344   '), TaakveldBalanspost 6 ('6.3   '), Categorie 8 ('L4.1.1  '). Verslagsoort without spaces: '2026X000' budget, '2026X001' to '2026X004' quarters, '2026X005' annual accounts. Without the right spaces: empty list, no error.
- Amounts (k_1ePlaatsing_1, k_2ePlaatsing_2) are in 1,000 euros. Use k_2ePlaatsing_2 (second release, with corrections).
- Category L… = expenses, B… = income. Policy areas 0.1 to 8.3 are programmes; 0.10 (reserve changes), 0.11 (result) and everything starting with a letter (A…, P…) are balance sheet items: leave them out.
- Main policy areas: 0 Administration and support, 1 Safety, 2 Traffic, transport and water, 3 Economy, 4 Education, 5 Sport, culture and recreation, 6 Social domain, 7 Public health and environment, 8 Spatial planning and housing.
- The table is a full cube (zeros included). More than 10,000 rows = HTTP 500 with a text message. $skip does not work and 'not' is ignored. One municipality, one report type, all L categories = 5,365 rows: fits. One policy area for all municipalities = 12,654: split into startswith(Categorie,'L4') and (startswith(Categorie,'L1') or … 'L2' … 'L3' … 'L5' … 'L6' … 'L7').
- Municipalities book differently (Amsterdam puts property tax in a different category than most). Always add up all expense categories of a policy area; never compare a single category.
- Small municipalities do not submit quarterly figures ('.' or null): treat null as missing, not 0, and only compare budget or annual accounts.
- Residents (v4): key without spaces ('GM0344'); abolished municipalities appear with Value null. Join on the trimmed code.
- Policy area 0 contains overhead, treasury and the general grant: not suitable for comparing municipalities. Start with 1 to 8.
- The data are unprocessed and not checked by CBS: a striking amount may be a booking error. Say so in the interface.

Output: at the top the chosen municipality with total and residents; a horizontal bar chart per main policy area in euros per resident; below that a picker with policy areas (names from /TaakveldBalanspost) and a ranking of all municipalities in euros per resident, with the median as a line and the chosen municipality highlighted. Cache responses for a day; CBS refreshes this table at most a few times a year.
Try it yourself
The core of the project in a small script. Needs: Node 20 of nieuwer (ingebouwde fetch); draai met: node gemeentebegroting.mjs [GM-code] [taakveld]. Tested on 2026-10-16; below is the real output of that run.
// Gemeentebegroting-verkenner: lasten per taakveld en per inwoner, en één taakveld vergeleken met alle gemeenten.
// Bronnen: Iv3 via dataderden.cbs.nl (OData v3) en CBS 37230ned (bevolking) via datasets.cbs.nl (OData v4). Node 20+.
const UA = { "User-Agent": "mijn-project/1.0 (+jij@voorbeeld.nl)" };
const GEMEENTE = process.argv[2] ?? "GM0344";     // Utrecht
const TAAKVELD = process.argv[3] ?? "6.3";        // Inkomensregelingen (bijstand)
const HOOFD = { 0: "Bestuur en ondersteuning", 1: "Veiligheid", 2: "Verkeer, vervoer en waterstaat", 3: "Economie",
  4: "Onderwijs", 5: "Sport, cultuur en recreatie", 6: "Sociaal domein", 7: "Volksgezondheid en milieu", 8: "Ruimte en wonen" };

const json = async (url) => { const r = await fetch(url, { headers: UA }); const t = await r.text();
  try { return JSON.parse(t); } catch { throw new Error(`${r.status}: ${t.slice(0, 150)}`); } };   // >10.000 rijen = HTTP 500 met tekst
const pad = (s, n) => s.padEnd(n);                 // Iv3-sleutels: gemeente 9 tekens, taakveld 6, categorie 8

// 1. Nieuwste jaartabel 'Gemeenten <jaar> onbewerkte Iv3-data' uit de catalogus.
const cat = await json("https://dataderden.cbs.nl/ODataCatalog/Tables?" + new URLSearchParams({
  $filter: "Catalog eq 'IV3' and startswith(Title,'Gemeenten')", $select: "Identifier,Title", $format: "json" }));
const [tabel] = cat.value.map((t) => ({ id: t.Identifier, jaar: +t.Title.match(/\d{4}/)[0] })).sort((a, b) => b.jaar - a.jaar);
const BEGROTING = `${tabel.jaar}X000`;             // X000 = begroting, X005 = jaarrekening
const iv3 = async (filter) => (await json(`https://dataderden.cbs.nl/ODataApi/OData/${tabel.id}/TypedDataSet?` +
  new URLSearchParams({ $filter: filter, $select: "Gemeenten,TaakveldBalanspost,Categorie,k_2ePlaatsing_2", $format: "json" }))).value;

// Namen: 'Utrecht (gemeente)' -> 'Utrecht'.
const namen = Object.fromEntries((await json(`https://dataderden.cbs.nl/ODataApi/OData/${tabel.id}/Gemeenten?$format=json`)).value
  .map((g) => [g.Key.trim(), g.Title.replace(/ \(gemeente\)$/, "")]));
const mln = (k) => (k / 1000).toLocaleString("nl-NL", { minimumFractionDigits: 1, maximumFractionDigits: 1 });
const eur = (x) => Math.round(x).toLocaleString("nl-NL");

// 2. Inwoners op 1 januari van het begrotingsjaar, alle gemeenten (oude gemeenten staan erin met Value null).
const bev = await json("https://datasets.cbs.nl/odata/v1/CBS/37230ned/Observations?" + new URLSearchParams({
  $filter: `Perioden eq '${tabel.jaar}MM01' and Measure eq 'M000098' and startswith(RegioS,'GM')`, $select: "RegioS,Value" }));
const inwoners = Object.fromEntries(bev.value.filter((r) => r.Value).map((r) => [r.RegioS, r.Value]));   // Value is niet filterbaar

// 3. Alle lasten (categorieën L…) van één gemeente: 145 taakvelden x 37 categorieën = 5.365 rijen, past in één keer.
const rijen = await iv3(`Gemeenten eq '${pad(GEMEENTE, 9)}' and Verslagsoort eq '${BEGROTING}' and startswith(Categorie,'L')`);
const per = {};
for (const r of rijen) {
  const tv = r.TaakveldBalanspost.trim();
  if (!/^[0-8]\.\d+$/.test(tv) || tv === "0.10" || tv === "0.11") continue;   // balansposten, reserves en resultaat eruit
  per[tv[0]] = (per[tv[0]] ?? 0) + (r.k_2ePlaatsing_2 ?? 0);                   // 1.000 euro
}
const n = inwoners[GEMEENTE];
console.log(`${namen[GEMEENTE]} (${GEMEENTE}), begroting ${tabel.jaar} (tabel ${tabel.id}), ${n.toLocaleString("nl-NL")} inwoners op 1 januari ${tabel.jaar}`);
console.log("hoofdtaakveld                     lasten (mln euro)   per inwoner");
let totaal = 0;
for (const [h, k] of Object.entries(per)) {
  totaal += k;
  console.log(`  ${h} ${pad(HOOFD[h], 32)} ${mln(k).padStart(8)}   ${eur((k * 1000) / n).padStart(10)}`);
}
console.log(`  totaal                            ${mln(totaal).padStart(8)}   ${eur((totaal * 1000) / n).padStart(10)}`);

// 4. Eén taakveld bij alle 342 gemeenten: 342 x 37 = 12.654 rijen is te veel (max 10.000, en $skip werkt hier niet).
//    Daarom in twee delen: categorie L4 (22 soorten) en de rest.
const f = `TaakveldBalanspost eq '${pad(TAAKVELD, 6)}' and Verslagsoort eq '${BEGROTING}'`;
const delen = await Promise.all([
  iv3(`${f} and startswith(Categorie,'L4')`),
  iv3(`${f} and (startswith(Categorie,'L1') or startswith(Categorie,'L2') or startswith(Categorie,'L3') or startswith(Categorie,'L5') or startswith(Categorie,'L6') or startswith(Categorie,'L7'))`),
]);
const lasten = {};
for (const r of delen.flat()) lasten[r.Gemeenten.trim()] = (lasten[r.Gemeenten.trim()] ?? 0) + (r.k_2ePlaatsing_2 ?? 0);
const rij = Object.entries(lasten).filter(([g]) => inwoners[g]).map(([g, k]) => ({ g, pi: (k * 1000) / inwoners[g] })).sort((a, b) => b.pi - a.pi);
const mediaan = rij[Math.floor(rij.length / 2)].pi;
const plek = rij.findIndex((x) => x.g === GEMEENTE) + 1;
console.log(`\nTaakveld ${TAAKVELD}, lasten per inwoner, ${rij.length} gemeenten: mediaan ${eur(mediaan)} euro`);
console.log(`  ${namen[GEMEENTE]}: ${eur(rij[plek - 1].pi)} euro, plaats ${plek} van ${rij.length} (1 = hoogst)`);
console.log("  hoogst:", rij.slice(0, 3).map((x) => `${namen[x.g]} ${eur(x.pi)}`).join(", "));
console.log("  laagst:", rij.slice(-3).map((x) => `${namen[x.g]} ${eur(x.pi)}`).join(", "));
Utrecht (GM0344), begroting 2026 (tabel 45078NED), 378.121 inwoners op 1 januari 2026
hoofdtaakveld                     lasten (mln euro)   per inwoner
  0 Bestuur en ondersteuning            510,6        1.350
  1 Veiligheid                           53,1          140
  2 Verkeer, vervoer en waterstaat      138,7          367
  3 Economie                             38,4          101
  4 Onderwijs                           110,7          293
  5 Sport, cultuur en recreatie         177,6          470
  6 Sociaal domein                      726,5        1.921
  7 Volksgezondheid en milieu           128,9          341
  8 Ruimte en wonen                     209,8          555
  totaal                             2.094,4        5.539

Taakveld 6.3, lasten per inwoner, 342 gemeenten: mediaan 353 euro
  Utrecht: 585 euro, plaats 64 van 342 (1 = hoogst)
  hoogst: Amsterdam 1.123, Rotterdam 1.113, 's-Gravenhage 1.072
  laagst: Terschelling 114, Ameland 98, Rozendaal 95
Where it goes wrong
- Keys have a different length per dimension and per table: Iv3 municipality 9 characters ('GM0344 '), district and neighbourhood key figures 10, population table 37230ned no spaces ('GM0344'). A wrong length returns an empty list without an error. Always read the keys from the dimension list (/Gemeenten).
- More than 10,000 rows gives HTTP 500 with plain text; JSON.parse then fails. $skip does not work on ODataApi and 'not startswith(…)' is ignored. Split your query by category or municipality. The ODataFeed address does support $skip, but according to our earlier measurements only applies the first filter predicate.
- Policy area 0 (administration and support) contains overhead, treasury and financing: 510.6 million for Utrecht in the 2026 budget. That says little about policy. Compare municipalities on policy areas 1 to 8 and always leave out 0.10 (reserve changes) and 0.11 (result), otherwise you double count.
- A budget is a plan. For what was actually spent you need the annual accounts (Verslagsoort <year>X005); those arrive in the following year, in another annual table (2025: 45071NED).
- Per resident does not tell everything: big cities have central tasks (shelter, regional social assistance) partly paid from earmarked grants. A high rank is not a judgement. Prefer comparing with municipalities of the same size.
- On 16 October 2026 opendata.cbs.nl returned HTTP 503 ('Service Unavailable') for a while, also on the catalogue, while dataderden.cbs.nl and datasets.cbs.nl answered normally. Build in a retry with a delay and cache the responses.
Take it further
- Put budget and annual accounts side by side: fetch the same municipality from 45071NED with Verslagsoort 2025X000 and 2025X005 and show per policy area where it spent more or less than planned.
- Make a map: join the euros per resident to the municipal boundaries from PDOK (CBS area divisions, statcode = GM code) and colour all 342 municipalities for the chosen policy area.
- Also show the income: add up the B categories for property tax (policy areas 0.61 and 0.62 together) and the general grant (0.7, category B4.3.1) and put them next to the expenses.
- Compare with municipalities of the same size: group by population (for example 50,000 to 100,000) and show that group's median instead of the national one.
More with this data
Budgeted property tax revenue per resident: highest in Schiermonnikoog (874 euros), lowest in Ooststellingwerf (134 euros)
Budgeted property tax revenue per resident per municipality, begroting 2026, in euros per resident. Netherlands as a whole: 350. 342 municipalities with a figure.
The sources2

Iv3, municipal budgets and accounts
Municipalities submit their budget, four quarterly reports and annual accounts to CBS in a fixed format: Information for third parties (Iv3). CBS publishes these figures unprocessed, per municipality, per policy area (from administration to youth care and waste) and per type of income or expense. There is one table per reporting year, also for provinces, water boards and joint arrangements.
Population change by month
Per municipality and month: how many people were born, died, moved in or left.
More to build
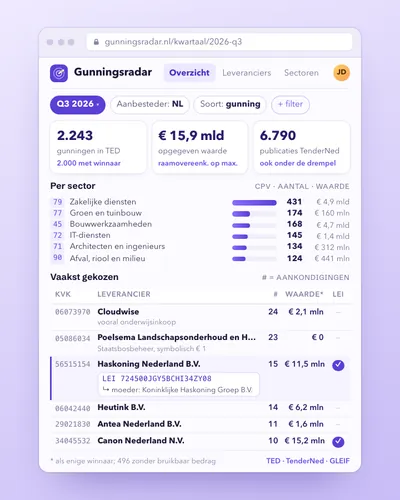 Procurement radar: who wins public contracts?Dashboard
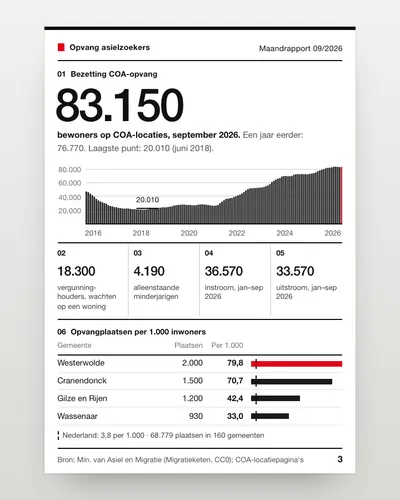 Asylum reception dashboard: national and per municipalityDashboard
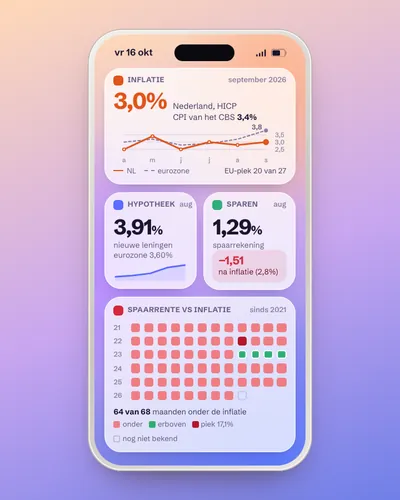 Monitor for inflation, mortgage rates and savings ratesDashboard
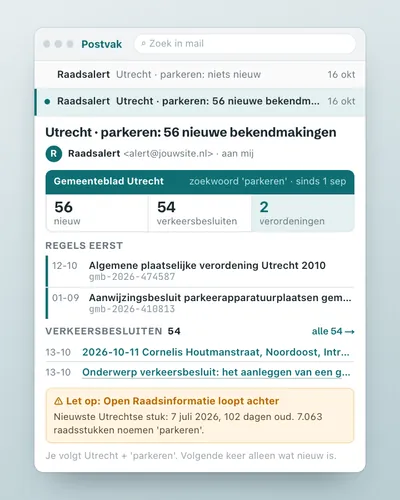 Council decision alert: a ping when your municipality decides somethingAlert
 National budget tracker: budgeted against spentDashboard
 Voting tracker: how did each party vote?App