Monitor for inflation, mortgage rates and savings rates
One dashboard that shows every month how fast prices rise, what a new mortgage costs and what savings earn, in the Netherlands and the euro area.


 With ECB Data Portal, CBS StatLine and Eurostat
geef_project("inflatie-rente-monitor")geef_bron("ecb-data")geef_bron("cbs-statline")geef_bron("eurostat")
I have the project, the tested calls and the pitfalls. I'll build a dashboard with ECB Data Portal, CBS StatLine and Eurostat. This is how it could look:
You build this yourself. Copy the prompt into Claude, ChatGPT or Cursor, with the MCP server on, or follow the steps below.
CBS CPI 3.4%
euro area 3.60%
This is a mockup, not a working version, with the figures from our test run on 16 October 2026 (ECB, CBS and Eurostat; inflation up to September, interest rates up to August 2026). Turn the MCP server on with the address on For AI.
Who it's for
Home buyers, savers, financial journalists, economics teachers and anyone who wants to know whether their savings keep up with inflation.
What you get
A page with three lines per area (inflation, mortgage rate, savings rate) for the Netherlands and the euro area, plus the gap between the savings rate and inflation. In the test run on 16 October 2026, inflation in September 2026 was 3.0% in the Netherlands (HICP) and 3.4% (CBS CPI), and 3.8% in the euro area. The rate on new mortgages was 3.91% in the Netherlands and 3.60% in the euro area in August 2026; the rate on savings redeemable at notice 1.29%. In 64 of the 68 months since January 2021 the Dutch savings rate was below inflation. Only from September to December 2023 did saving pay in real terms, when lower energy prices briefly pushed inflation below zero (October 2023: -1.0%). The peak: 17.1% inflation in September 2022, against 9.9% in the euro area. Among EU countries the Netherlands ranked 20th of 27 in September 2026 (1 = highest inflation); Romania had 6.5%, Sweden 1.0%.
Inflation in the Netherlands: 3.0 percent in September 2026, 0.8 percentage points lower than in the euro area (3.8 percent)
Inflation in the Netherlands and the euro area (HICP, ECB Data Portal), January 2015 – September 2026, in percent. The highest point was September 2022 (17.1).
How you could start5 steps
- 1
Fetch inflation from the ECB, the Netherlands and the euro area in one call
Dataflow HICP, key M.NL+U2.N.000000.4D0.ANR: monthly (M), the Netherlands plus euro area (U2), not seasonally adjusted (N), all items (000000), provided by Eurostat (4D0), annual rate (ANR). Use + to ask for several codes within one dimension. Use the HICP dataflow, not the old ICP one: it stopped in December 2025. Always set your own User-Agent: the ECB robots.txt disallows the user agents curl, Wget, python-requests and axios.
https://data-api.ecb.europa.eu/service/data/HICP/M.NL+U2.N.000000.4D0.ANR?lastNObservations=3&format=csvdata&detail=dataonly
KEY,FREQ,REF_AREA,ADJUSTMENT,ICP_ITEM,DATA_PROVIDER,ICP_SUFFIX,TIME_PERIOD,OBS_VALUE
HICP.M.NL.N.000000.4D0.ANR,M,NL,N,000000,4D0,ANR,2026-07,3
HICP.M.NL.N.000000.4D0.ANR,M,NL,N,000000,4D0,ANR,2026-08,2.8
HICP.M.NL.N.000000.4D0.ANR,M,NL,N,000000,4D0,ANR,2026-09,3
HICP.M.U2.N.000000.4D0.ANR,M,U2,N,000000,4D0,ANR,2026-07,2.9
HICP.M.U2.N.000000.4D0.ANR,M,U2,N,000000,4D0,ANR,2026-08,3.2
HICP.M.U2.N.000000.4D0.ANR,M,U2,N,000000,4D0,ANR,2026-09,3.8
- 2
Fetch mortgage and savings rates from the MIR series
In the MIR dataflow (bank interest rates), A2C is lending for house purchase and L23 savings redeemable at notice, what most people call a savings account (L21 is the current account, L22 a fixed-term deposit). Maturity AM is the 'cost of borrowing', weighted over all fixation periods; A is the simple total. The last field N means new business. You may use + in several dimensions at once: you then get every combination that exists (L23 has no AM, so it drops out). The rates run one month behind inflation.
https://data-api.ecb.europa.eu/service/data/MIR/M.NL+U2.B.A2C+L23.AM+A.R.A.2250.EUR.N?lastNObservations=2&format=csvdata&detail=dataonly
KEY,FREQ,REF_AREA,BS_REP_SECTOR,BS_ITEM,MATURITY_NOT_IRATE,DATA_TYPE_MIR,AMOUNT_CAT,BS_COUNT_SECTOR,CURRENCY_TRANS,IR_BUS_COV,TIME_PERIOD,OBS_VALUE
MIR.M.NL.B.A2C.A.R.A.2250.EUR.N,M,NL,B,A2C,A,R,A,2250,EUR,N,2026-07,3.87
MIR.M.NL.B.A2C.A.R.A.2250.EUR.N,M,NL,B,A2C,A,R,A,2250,EUR,N,2026-08,3.94
MIR.M.NL.B.A2C.AM.R.A.2250.EUR.N,M,NL,B,A2C,AM,R,A,2250,EUR,N,2026-07,3.85
MIR.M.NL.B.A2C.AM.R.A.2250.EUR.N,M,NL,B,A2C,AM,R,A,2250,EUR,N,2026-08,3.91
MIR.M.NL.B.L23.A.R.A.2250.EUR.N,M,NL,B,L23,A,R,A,2250,EUR,N,2026-07,1.27
MIR.M.NL.B.L23.A.R.A.2250.EUR.N,M,NL,B,L23,A,R,A,2250,EUR,N,2026-08,1.29
…
MIR.M.U2.B.A2C.AM.R.A.2250.EUR.N,M,U2,B,A2C,AM,R,A,2250,EUR,N,2026-08,3.6
MIR.M.U2.B.L23.A.R.A.2250.EUR.N,M,U2,B,L23,A,R,A,2250,EUR,N,2026-08,1.28
- 3
Add the CBS consumer price index
Dutch inflation in the news usually comes from CBS (CPI), not from the HICP. Table 86141NED (CPI 2025=100), column JaarmutatieCPI_5. The key for all items is 'T001112 ' with two trailing spaces; without them you get an empty list and no error. In September 2026 the CPI was 3.4% and the HICP 3.0%: the CPI includes, among other things, owner-occupied housing costs. On the evening of 16 October 2026 opendata.cbs.nl returned 'Service Unavailable' for an hour; the newer OData 4 service datasets.cbs.nl/odata/v1/CBS/86141NED still worked (fields Measure M000238, Bestedingscategorieen, Perioden).
https://opendata.cbs.nl/ODataApi/OData/86141NED/TypedDataSet?$filter=Bestedingscategorieen eq 'T001112 ' and Perioden ge '2026MM06'&$select=Perioden,JaarmutatieCPI_5&$format=json
{ "odata.metadata":"https://opendata.cbs.nl/ODataApi/OData/86141NED/$metadata#Cbs.OData.WebAPI.TypedDataSet&$select=Perioden,JaarmutatieCPI_5","value":[ {"Perioden":"2026MM06","JaarmutatieCPI_5":2.9}, {"Perioden":"2026MM07","JaarmutatieCPI_5":3.2}, {"Perioden":"2026MM08","JaarmutatieCPI_5":3.3}, {"Perioden":"2026MM09","JaarmutatieCPI_5":3.4} ] } - 4
Compare with all EU countries through Eurostat
The ECB only has euro countries; Eurostat has all 27 EU countries, including Sweden, Poland and Hungary. Use table prc_hicp_minr (ECOICOP version 2, dimension coicop18, unit RCH_A). The well-known table prc_hicp_manr stops at December 2025 (updated 6 February 2026) and so has no 2026. Note: EA is the euro area in changing composition, since 2026 with 21 countries (Bulgaria joined).
https://ec.europa.eu/eurostat/api/dissemination/statistics/1.0/data/prc_hicp_minr?geo=NL&geo=EA&geo=EU27_2020&unit=RCH_A&coicop18=TOTAL&lastTimePeriod=3&format=JSON
{"label":"Harmonised index of consumer prices (HICP) - ECOICOP ver.2 - indices and rates of change, monthly data", "updated":"2026-10-16T23:00:00+0200", "id":["freq","unit","coicop18","geo","time"],"size":[1,1,1,3,3], "value":{"0":3,"1":3.2,"2":3.8,"3":2.9,"4":3.2,"5":3.8,"6":3,"7":2.8,"8":3}, "dimension":{"geo":{"category":{"index":{"EU27_2020":0,"EA":1,"NL":2}}}, "time":{"category":{"index":{"2026-07":0,"2026-08":1,"2026-09":2}}}, …}} - 5
Compute the real savings rate and draw the dashboard
Real savings rate = savings rate minus inflation in the same month. Join on month (ECB: 2026-08, CBS: 2026MM08). The rates arrive a month after inflation, so the newest month has no rate yet: leave it empty and say so. Draw the Netherlands in orange and the euro area dotted grey for each series. State under the chart which measure it is (HICP or CPI) and the date you fetched it.
How the sources fit together
- ECB Data PortalCBS StatLinevia
maand (ECB 2026-09, CBS 2026MM09)The ECB provides the European inflation measure (HICP) and the bank rates, CBS the Dutch CPI. Put them side by side per month and explain why they differ (owner-occupied housing, among other things).
- ECB Data PortalEurostatvia
landcode (ECB NL en U2, Eurostat NL en EA; Griekenland is EL)The HICP at the ECB comes from Eurostat (DATA_PROVIDER 4D0) and the figures are the same. Eurostat also has the EU countries outside the euro, the ECB has the rates Eurostat lacks.
Let AI build it
Paste this prompt into Claude, ChatGPT, Cursor or Lovable. It names the real endpoints, the join keys and the pitfalls, so the assistant writes working code straight away. Always check the result against the source itself.
Build a dashboard (one HTML file with JavaScript and Chart.js, or a small Python script with Plotly) that shows three things per month since January 2021 for the Netherlands and the euro area: inflation, the rate on new mortgages and the rate on savings, plus the real savings rate (savings rate minus inflation).

Data, all without a key:
1. ECB Data Portal (SDMX, CSV):
   - Inflation: https://data-api.ecb.europa.eu/service/data/HICP/M.NL+U2.N.000000.4D0.ANR?startPeriod=2021-01&format=csvdata&detail=dataonly
   - Mortgage rate: https://data-api.ecb.europa.eu/service/data/MIR/M.NL+U2.B.A2C.AM.R.A.2250.EUR.N?startPeriod=2021-01&format=csvdata&detail=dataonly
   - Savings rate: https://data-api.ecb.europa.eu/service/data/MIR/M.NL+U2.B.L23.A.R.A.2250.EUR.N?startPeriod=2021-01&format=csvdata&detail=dataonly
   Columns REF_AREA (NL or U2), TIME_PERIOD (2026-08), OBS_VALUE (percent).
2. CBS, Dutch CPI: https://opendata.cbs.nl/ODataApi/OData/86141NED/TypedDataSet?$filter=Bestedingscategorieen eq 'T001112  ' and Perioden ge '2021MM01'&$select=Perioden,JaarmutatieCPI_5&$format=json
3. Eurostat, all EU countries for the newest month: https://ec.europa.eu/eurostat/api/dissemination/statistics/1.0/data/prc_hicp_minr?unit=RCH_A&coicop18=TOTAL&lastTimePeriod=1&format=JSON

What you need to know:
- Send your own User-Agent (for example 'my-project/1.0 (+you@example.com)'). The robots.txt of data-api.ecb.europa.eu disallows the user agents curl, Wget, python-requests, axios and Go-http-client.
- Never use * as a wildcard in an ECB key: the firewall answers with HTTP 400 and an HTML page 'Your access has been blocked'. Leave a dimension empty (two dots) or list codes with +. Do not glue two full keys together with + either: that triggered the same block.
- Use the HICP dataflow with DATA_PROVIDER 4D0. The old ICP dataflow only ran to December 2025 on 16 October 2026.
- MIR: A2C = housing loan, L23 = savings redeemable at notice (savings account), L21 = current account, L22 = fixed-term deposit. AM = weighted 'cost of borrowing'. Last field N = new business.
- The rates run one month behind inflation. Leave the newest month empty for the rates and show 'not yet available'.
- CBS: keys are padded with spaces; 'T001112  ' has two. Without them you get an empty list. Convert periods like '2026MM09' to '2026-09'. Rows with 'JJ' in Perioden are years: skip them. If opendata.cbs.nl returns 'Service Unavailable', use https://datasets.cbs.nl/odata/v1/CBS/86141NED/Observations with $filter=Measure eq 'M000238' and Bestedingscategorieen eq 'T001112'.
- HICP and CPI differ (September 2026: 3.0 against 3.4 percent). Label each line with the measure.
- Eurostat: use prc_hicp_minr (dimension coicop18), not prc_hicp_manr (stops at December 2025). JSON-stat: values in one flat object 'value'; position = geo index × number of periods + period index. Filter on the 27 EU codes (Greece is EL); EA is the euro area in changing composition.
- U2 is the euro area in changing composition: a long series does not always contain the same countries.
- The ECB terms ask for attribution and that you state what you computed yourself (here: the real savings rate).

Output: at the top three tiles with the newest value for the Netherlands and the gap with the euro area, with the month. Below that three line charts (Netherlands orange, euro area dotted grey) and a bar chart of the real savings rate per month (negative = red). At the bottom a sorted list of EU countries for the newest month with the Netherlands highlighted. Source and fetch date under every chart.
Try it yourself
The core of the project in a small script. Needs: Python 3.10+ en requests. Tested on 2026-10-16; below is the real output of that run.
# Inflatie, hypotheekrente en spaarrente: Nederland tegen de eurozone, per maand sinds 2021.
# Bronnen: ECB Data Portal (HICP en MIR), CBS StatLine (CPI 86141NED), Eurostat (HICP per EU-land). Geen sleutel nodig.
import csv, io, requests

# Eigen User-Agent is verplicht: robots.txt van de ECB verbiedt de user-agent 'python-requests'.
UA = {"User-Agent": "mijn-project/1.0 (+jij@voorbeeld.nl)"}
ECB = "https://data-api.ecb.europa.eu/service/data"
VANAF = "2021-01"

def ecb(flow, sleutel):
    """Eén ECB-reeks per land als {(land, 'JJJJ-MM'): waarde}. Gebruik + per dimensie, nooit een *."""
    r = requests.get(f"{ECB}/{flow}/{sleutel}", headers=UA, timeout=60,
                     params={"startPeriod": VANAF, "format": "csvdata", "detail": "dataonly"})
    r.raise_for_status()
    return {(x["REF_AREA"], x["TIME_PERIOD"]): float(x["OBS_VALUE"]) for x in csv.DictReader(io.StringIO(r.text))}

hicp = ecb("HICP", "M.NL+U2.N.000000.4D0.ANR")            # inflatie, % t.o.v. dezelfde maand een jaar eerder
hypo = ecb("MIR", "M.NL+U2.B.A2C.AM.R.A.2250.EUR.N")       # rente nieuwe woninghypotheken, % per jaar
spaar = ecb("MIR", "M.NL+U2.B.L23.A.R.A.2250.EUR.N")       # rente op direct opvraagbaar sparen (met opzegtermijn)

# CBS: de nationale CPI. Sleutel 'T001112  ' (alle bestedingen) heeft twee spaties aan het eind.
cbs = requests.get("https://opendata.cbs.nl/ODataApi/OData/86141NED/TypedDataSet", headers=UA, timeout=60, params={
    "$filter": f"Bestedingscategorieen eq 'T001112  ' and Perioden ge '{VANAF[:4]}MM01'",
    "$select": "Perioden,JaarmutatieCPI_5", "$format": "json"}).json()["value"]
cpi = {r["Perioden"][:4] + "-" + r["Perioden"][6:]: r["JaarmutatieCPI_5"] for r in cbs if "MM" in r["Perioden"]}

maanden = sorted({m for (_, m) in hicp})
laatste = maanden[-1]
print(f"Nieuwste maand inflatie: {laatste}; nieuwste maand rentes: {max(m for (_, m) in hypo)}\n")
def f(x, d=1):   # getal of streepje als de maand (nog) ontbreekt
    return f"{x:.{d}f}" if x is not None else "-"

print("maand    inflatie NL (HICP/CPI)  eurozone  hypotheek NL/EZ  sparen NL  sparen min inflatie")
for m in maanden[-6:]:
    h, s = hicp[("NL", m)], spaar.get(("NL", m))
    print(f"{m}  {f(h):>5} / {f(cpi.get(m)):<5}         {f(hicp[('U2', m)]):>4}     "
          f"{f(hypo.get(('NL', m)), 2):>4} / {f(hypo.get(('U2', m)), 2):<4}      {f(s, 2):>4}       {f(s - h if s else None, 2):>5}")

piek = max(maanden, key=lambda m: hicp[("NL", m)])
print(f"\nHoogste inflatie NL sinds {VANAF}: {hicp[('NL', piek)]}% in {piek} (eurozone {hicp[('U2', piek)]}%)")
laagste_hypo = min((m for (l, m) in hypo if l == "NL"), key=lambda m: hypo[("NL", m)])
print(f"Laagste hypotheekrente NL: {hypo[('NL', laagste_hypo)]}% in {laagste_hypo}")
negatief = sum(1 for m in maanden if ("NL", m) in spaar and spaar[("NL", m)] < hicp[("NL", m)])
print(f"Maanden waarin de spaarrente in NL onder de inflatie lag: {negatief} van {sum(1 for m in maanden if ('NL', m) in spaar)}")

# Eurostat: waar staat Nederland tussen de EU-landen in de nieuwste maand? Tabel prc_hicp_minr (sinds 2026, ECOICOP 2).
EU27 = "BE BG CZ DK DE EE IE EL ES FR HR IT CY LV LT LU HU MT NL AT PL PT RO SI SK FI SE".split()
j = requests.get("https://ec.europa.eu/eurostat/api/dissemination/statistics/1.0/data/prc_hicp_minr", headers=UA, timeout=60,
                 params={"unit": "RCH_A", "coicop18": "TOTAL", "lastTimePeriod": 1, "format": "JSON", "geo": EU27}).json()
geo = j["dimension"]["geo"]["category"]["index"]
periode = list(j["dimension"]["time"]["category"]["index"])[0]
landen = sorted(((j["value"][str(i)], g) for g, i in geo.items() if str(i) in j["value"]), reverse=True)
plek = [g for _, g in landen].index("NL") + 1
print(f"\nEurostat {periode}: Nederland {j['value'][str(geo['NL'])]}%, plek {plek} van {len(landen)} EU-landen (1 = hoogste inflatie)")
print("Hoogst:", ", ".join(f"{g} {v}%" for v, g in landen[:3]), "| laagst:", ", ".join(f"{g} {v}%" for v, g in landen[-3:]))
Nieuwste maand inflatie: 2026-09; nieuwste maand rentes: 2026-08

maand    inflatie NL (HICP/CPI)  eurozone  hypotheek NL/EZ  sparen NL  sparen min inflatie
2026-04    2.5 / 2.8            3.0     3.63 / 3.44      1.27       -1.23
2026-05    3.4 / 3.5            3.2     3.66 / 3.48      1.27       -2.13
2026-06    2.5 / 2.9            2.8     3.71 / 3.51      1.27       -1.23
2026-07    3.0 / 3.2            2.9     3.85 / 3.54      1.27       -1.73
2026-08    2.8 / 3.3            3.2     3.91 / 3.60      1.29       -1.51
2026-09    3.0 / 3.4            3.8        - / -            -           -

Hoogste inflatie NL sinds 2021-01: 17.1% in 2022-09 (eurozone 9.9%)
Laagste hypotheekrente NL: 1.65% in 2021-09
Maanden waarin de spaarrente in NL onder de inflatie lag: 64 van 68

Eurostat 2026-09: Nederland 3.0%, plek 20 van 27 EU-landen (1 = hoogste inflatie)
Hoogst: RO 6.5%, LT 6.1%, BG 5.6% | laagst: HU 2.1%, DK 2.1%, SE 1.0%
Where it goes wrong
- An * in an ECB key (for example M.*.N.000000.4D0.ANR) returned HTTP 400 with an HTML page 'Your access has been blocked due to security concerns'. The same happened with two full keys glued together with +. Use + within one dimension or leave the dimension empty.
- The robots.txt of data-api.ecb.europa.eu excludes the default user agents of curl, Wget, python-requests, axios, Java and Go. A call often still works technically, but always set your own recognisable User-Agent (curl -A, headers in requests).
- Old tables stop silently: the ECB ICP dataflow and the Eurostat table prc_hicp_manr run to December 2025. Anyone following a pre-2026 tutorial sees no new months and no error. Use HICP (ECB) and prc_hicp_minr (Eurostat).
- HICP is not the CPI. In September 2026 the Dutch HICP was 3.0% and the CBS CPI 3.4%. Always name the measure you show; news reports usually use the CPI.
- CBS keys with spaces: 'T001112 ' (two spaces) returns data, 'T001112' an empty list without an error.
- The savings rate in MIR is an average over all Dutch banks (L23, savings redeemable at notice). Your own bank can differ a lot. Mortgage rate AM is weighted over all fixation periods: a ten-year rate at one bank is something else.
- The euro area (U2 at the ECB, EA at Eurostat) changes composition; Bulgaria joined in 2026. A comparison over twenty years is therefore not always the same group of countries.
Take it further
- Add the ECB's own policy rate (dataflow FM, deposit facility rate DFR, a daily series) and show how quickly banks pass a rate cut on to mortgages and savers.
- Split inflation by product group with the CBS table (Bestedingscategorieen, for example energy, food, rent) and find out what caused the 2022 peaks and the October 2023 dip.
- Put the mortgage rate next to the Eurostat house price index (prc_hpi_q) or the CBS price index of existing homes and see whether a rate drop shows up in prices later.
- Turn it into a monthly alert: run the script after CBS publishes inflation (early in the month) and send a message when the real savings rate changes sign.
More with this data
Interest rate on new bank mortgages (DNB figures via the ECB Data Portal): 3.91 percent a year in August 2026, 0.9 percentage points lower than in January 2003
Interest rate on new bank mortgages (DNB figures via the ECB Data Portal), January 2003 – August 2026, in percent a year. The highest point was October 2008 (5.63).
Interest rate on household savings accounts (DNB figures via the ECB Data Portal): 1.29 percent a year in August 2026, 1.2 percentage points lower than in July 2006
Interest rate on household savings accounts (DNB figures via the ECB Data Portal), July 2006 – August 2026, in percent a year. The highest point was January 2009 (3.20).
Inflation in the Netherlands: higher than in 15 of the 26 other EU countries
Inflation in 2025, in percent (annual average, HICP). Netherlands: 3.0; EU average: 2.5. Highest: Romania (6.8); lowest: Cyprus (0.8).
The sources3
ECB Data Portal
The European Central Bank's data portal, with over a hundred dataflows: ECB policy rates, exchange rates, inflation (HICP), bank mortgage and savings rates, bank balance sheets, money supply and payments. For the Netherlands it holds figures that De Nederlandsche Bank reports to the ECB, always next to the other euro countries. All through an open SDMX API, no key needed. In September 2026 inflation was 3.0 percent in the Netherlands and 3.8 percent in the euro area.
CBS StatLine
The statistics database of Statistics Netherlands: almost 6,000 tables on population, economy, work, housing, energy, care and more, most with long annual, quarterly or monthly series.
EurostatIn depth
Thousands of tables that put the Netherlands next to other EU countries: prices, jobs, population, health, energy. Often down to regional level.
More to build
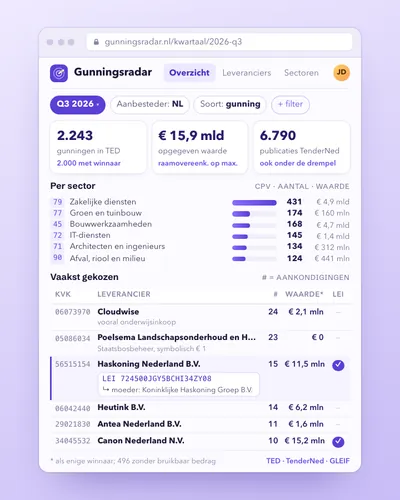 Procurement radar: who wins public contracts?Dashboard
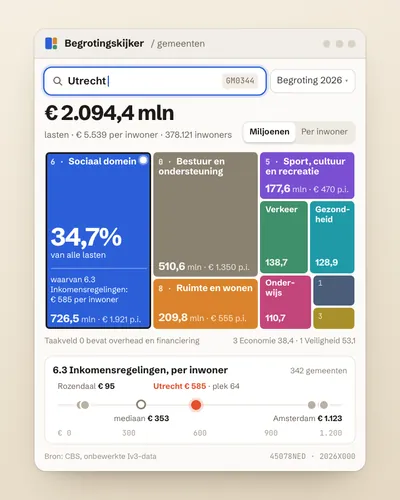 Municipal budget explorer: what does my municipality spend money on?Tool
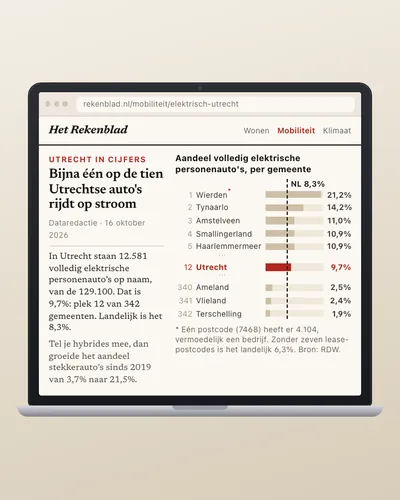 How fast is your municipality going electric?Analysis
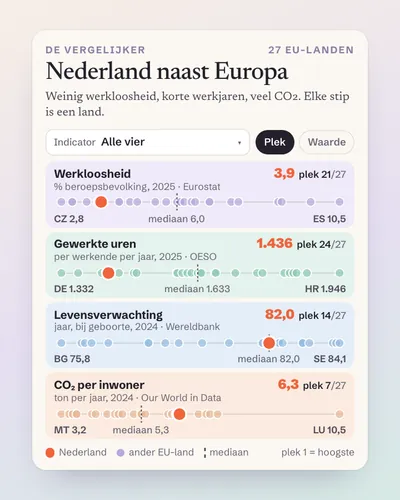 The Netherlands next to Europe: a comparison tool for any indicatorTool
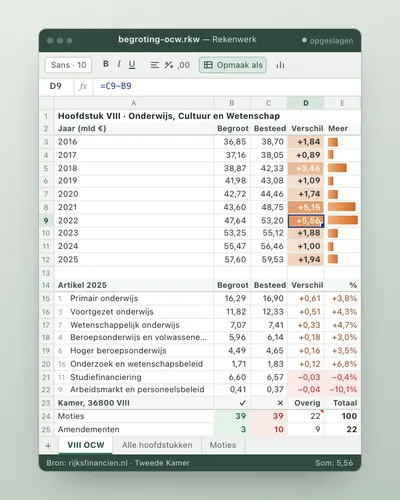 National budget tracker: budgeted against spentDashboard
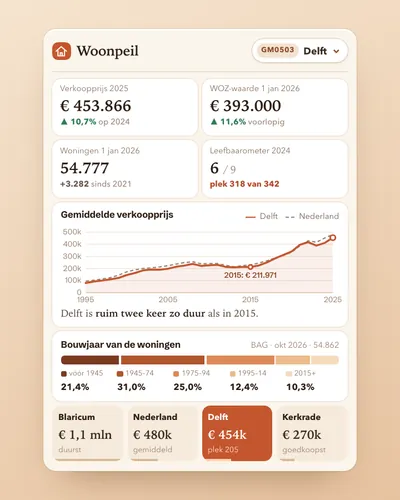 Housing market dashboard for your municipalityDashboard