Asylum reception dashboard: national and per municipality
A dashboard that shows how many people live in COA reception since 2016, how many arrive and leave, and how many reception places each municipality has, also per 1,000 residents.
The Open Data Index MCP server is on in your chat, so the assistant reads this project and its sources itself.
You paste this project's prompt
Build a dashboard about asylum reception in the Netherlands (Node 20+ for fetching, the page in plain HTML with JavaScript or a small Next.js project). No keys needed.
The assistant fetches from Open Data Index
geef_project("asielopvang-dashboard")
geef_bron("coa-opvang")
geef_bron("coa-locaties")
geef_bron("cbs-bevolking-maand")
The assistant
I have the project, the tested calls and the pitfalls. I'll build a dashboard with Asylum reception in figures (COA), COA reception locations and Population change by month. This is how it could look:
You build this yourself. Copy the prompt into Claude, ChatGPT or Cursor, with the MCP server on, or follow the steps below.
residents at COA locations, September 2026. A year earlier: 76,770. Lowest point: 20,010 (June 2018).
20,000
40,000
60,000
80,000
20,010
201620182020202220242026
0218,300permit holders, waiting for a home
034,190unaccompanied minors
0436,570intake, Jan–Sep 2026
0533,570outflow, Jan–Sep 2026
06 Reception places per 1,000 inhabitants
Municipality
Places
Per 1,000
Westerwolde
2,000
79.8
Cranendonck
1,500
70.7
Gilze en Rijen
1,200
42.4
Wassenaar
930
33.0
Netherlands: 3.8 per 1,000 · 68,779 places in 160 municipalities
Mockup
This is a mockup, not a working version, with the figures from the Ministry of Asylum and Migration (occupancy up to September 2026) and the COA location pages, as fetched in our test run on 16 October 2026. Turn the MCP server on with the address on For AI.
Who it's for
Council members and clerks who want to back the debate on reception and the dispersal act with figures, local journalists, fact-checkers and anyone who wants to know how much reception there is in their own municipality, next to the national picture.
What you get
A page with three parts, tested on 16 October 2026:
- **National over time**: occupancy of COA reception per month since January 2016 (129 months). In September 2026, 83,150 people lived in reception, against 76,770 a year earlier and 20,010 at the low point in June 2018. Of them, 18,300 already had a residence permit (they are waiting for a home) and 4,190 were unaccompanied minors. Syria is by far the largest country of origin (28,190 residents), followed by Eritrea (5,760).
- **Intake and outflow**: from January to September 2026, 36,570 people entered reception and 33,570 left (all of 2025: 51,660 in, 44,730 out).
- **Per municipality**: 261 COA location pages, 251 with a capacity, together 68,779 reception places in 160 municipalities. Linked to the population (CBS, start of August 2026) that is 3.8 places per 1,000 residents nationally. Westerwolde (Ter Apel) tops the list with 79.8 per 1,000, followed by Cranendonck (70.7) and Gilze en Rijen (42.4). Zuid-Holland (13,086) and Noord-Holland (13,055) have the most places, Zeeland the fewest (1,871). 182 municipalities have no COA location with its own page.
Mind the gap: the capacity on the location pages (68,779) is lower than the number of residents (83,150). Not every location has a page (the COA itself mentions 329) and capacity is not occupancy.
Residents of COA reception locations: 83,150 residents in september 2026, 77% more than in januari 2016
Residents of COA reception locations, januari 2016 – september 2026, in residents. The highest point was juni 2026 (83,420).
Source: Ministerie van Asiel en Migratie, Migratieketen: COA-opvang (data.overheid.nl, CC0) · opgehaald 25 oktober 2026 · selection: Alle bewoners van COA-locaties, ook vergunninghouders; Aantallen afgerond op tientallenOpen the table Single block
How you could start7 steps
1
Find the yearly occupancy files
The Ministry of Asylum and Migration publishes the COA figures as one CSV per year on data.overheid.nl (CC0). The links are on the dataset page, also in the schema.org data (DataDownload, contentUrl). Use that page, not the CKAN API: robots.txt of data.overheid.nl forbids /data/, where that API lives. Pitfall: 2016 to 2023 sit in a different folder than 2024 to 2026, and 2020 is called '…2020_2.csv'. So sort by the year in the file name, not by the whole URL.
Semicolons as separator. Every row has a column 'Totaal van' that says which breakdown it is: 'Jaar, Maand' is the monthly total, 'Jaar, Maand, Vergunninghouder' splits by status, 'Jaar, Maand, Amv' counts unaccompanied minors. *Alle* means: all values together. Pick one breakdown per number, otherwise you count twice. Pitfalls: the encoding changes (2024 and 2025 UTF-8 with BOM, the other years Windows-1252), the month is written as '1' or as '01', and the Amv column only exists since 2024. Take the last column as the count, because its name differs per file.
Intake and outflow are two separate datasets with the same structure (immigratie-coa-opvang-en-onderdak-instroom and -uitstroom), but with fewer columns. Here there is also a 'Jaar' row with the year-to-date total. Everything is rounded to tens: the nine months of 2026 add up to 36,590, the year row says 36,570. Use the year row for the year and the month rows for the chart, and never add up details to get a total.
Nummer;Totaal van;Jaar;Maand;Land van herkomst;Aantal ontvangen in opvang
1;Jaar;2026;*Alle*;*Alle*;36570
2;Jaar, Maand;2026;1;*Alle*;4190
2;Jaar, Maand;2026;2;*Alle*;4140
...
2;Jaar, Maand;2026;8;*Alle*;3220
2;Jaar, Maand;2026;9;*Alle*;3630
4
Walk the locations in our index
The COA has no file or API with locations; each location only has a page on coa.nl. We read those 261 pages every Monday, look up the address in the BAG and place it in the municipal boundaries. Our catalogue API returns the tree province, municipality, location: without a path the provinces, with ?pad=/0 the municipalities in Drenthe, with ?pad=/0/0 the locations in Assen. The folder 'Onbekend' holds one location without a usable address. That way you don't have to call coa.nl itself 261 times.
Each location has a dataset page with us showing capacity, type, term of the agreement with the municipality, address and municipality. The description always starts with 'Capaciteit: <number>', also in the meta description, so one regex is enough. Ten of the 261 pages state no capacity: they are not counted. The text comes straight from coa.nl and can be out of date (Assen: 'expires on 1 April 2026', while the location is still on the site).
<meta name="description" content="Capaciteit: 2000 opvangplaatsen. Type locatie: centrale ontvangstlocatie (col), procesopvanglocatie (pol), alleenstaande minderjarige vreemdelingen (amv) en …"
...
Capaciteit: 2000 opvangplaatsen. Type locatie: centrale ontvangstlocatie (col), procesopvanglocatie (pol), alleenstaande minderjarige vreemdelingen (amv) en vrijheidsbeperkende locatie (vbl).. De opvang bestaat sinds 1996. De huidige bestuursovereenkomst loopt tot 17 mei 2040. Adres: Ter Apelervenen 4 en 5, 9561 MC Ter Apel. Gemeente Westerwolde (Groningen).
6
Or read coa.nl itself
If you don't want to depend on our index: the coa.nl sitemap (sitemap.xml?page=1 and page=2) lists every location page under /nl/locatie/, and robots.txt allows them. Every URL appears twice in the sitemap: deduplicate. Capacity, type and agreement sit in blocks (li class=infographic__item) in varying order; look them up by title, not by position. The overview /nl/locaties returned 403. Do not copy names, phone numbers or email addresses of staff. Municipality from the address: the PDOK BAG WFS on postcode and house number, not the PDOK Locatieserver (robots.txt of api.pdok.nl forbids it).
CBS table 37230ned gives the population at the start of each month (measure M000098). We use the new OData v4 on datasets.cbs.nl: codes there are not padded with spaces ('GM0363', not 'GM0363 ') and on 16 October 2026 the old v3 (opendata.cbs.nl) returned 503 for a while. The list also holds former municipalities with Value null: 556 rows, 342 with a value. Get names from RegioSCodes; strip ' (gemeente)' from the end ('Utrecht (gemeente)', "'s-Gravenhage (gemeente)"), then they match the municipality names in our index (160 of 160). The latest months are provisional.
The monthly figures count residents, but only nationally. The location pages give capacity per location and therefore per municipality. Put them side by side as occupancy versus capacity, but don't divide one by the other: not every location has a page (261 pages, the COA mentions 329 locations) and the sum of capacity (68,779) is lower than the number of residents (83,150, September 2026).
Our index gives the municipality per location (2025 boundaries). Join by name to RegioSCodes of CBS 37230ned after removing ' (gemeente)', then carry the GM code along; with it you divide the places by the population. Tested: all 160 municipalities with reception found a population.
Both are monthly series. Occupancy is the state in a month, the CBS population is the start of the month: plot them with the same month on the axis and mention the difference in reference date.
Let AI build it
Paste this prompt into Claude, ChatGPT, Cursor or Lovable. It names the real endpoints, the join keys and the pitfalls, so the assistant writes working code straight away. Always check the result against the source itself.
Build a dashboard about asylum reception in the Netherlands (Node 20+ for fetching, the page in plain HTML with JavaScript or a small Next.js project). No keys needed.

Part 1, national per month since 2016 (COA, via the Ministry of Asylum and Migration, CC0):
- Fetch https://data.overheid.nl/dataset/immigratie-coa-opvang-en-onderdak-bezetting and extract all links to .csv (regex on https://data.overheid.nl/sites/default/files/dataset/…csv). Do NOT use the CKAN API under /data/api: robots.txt forbids /data/.
- Sort the files by the year in the name: 2016 to 2023 are in a different folder than 2024 to 2026, and 2020 is called "…2020_2.csv".
- CSV with semicolons. Encoding varies: try strict UTF-8 (fatal), otherwise Windows-1252; strip a BOM. The month is "1" or "01".
- The column "Totaal van" defines the breakdown. Monthly total: "Jaar, Maand". Permit holders: "Jaar, Maand, Vergunninghouder" with Vergunninghouder = "Vergunninghouder". Unaccompanied minors: "Jaar, Maand, Amv" with Amv = "Amv" (column only exists since 2024). Country of origin: "Jaar, Maand, Land van herkomst". "*Alle*" means all values together. Never mix breakdowns or add up details: everything is rounded to tens and counts below 5 are missing.
- The count is in the last column; its name differs per dataset ("Aantal bezetting opvang", "Aantal ontvangen in opvang", "Aantal uitgestroomd uit opvang").
- Country names change per year: "Syrië" in 2023, "Syrie" in 2025 and 2026; "Bosnië-Herzegovina" became "Bosnië en Herzegovina". Normalise (strip accents, lower case) before following countries across years.
- Intake and outflow: same approach with the datasets immigratie-coa-opvang-en-onderdak-instroom and immigratie-coa-opvang-en-onderdak-uitstroom; there "Jaar" is the year total.
- A new monthly file can correct earlier months: refetch the whole year every month.

Part 2, reception places per municipality (COA location pages, read weekly by Open Data Index):
- Tree: https://www.opendataindex.nl/api/catalogus/coa-locaties returns provinces (children with a path), ?pad=/0 the municipalities in a province, ?pad=/0/0 the locations (items with sleutel and titel). Skip the folder "Onbekend".
- Per location: https://www.opendataindex.nl/dataset/coa-locaties/<sleutel>. The meta description starts with "Capaciteit: <number>". No number = don't count it (10 of 261 on 16 October 2026). At most 4 requests at a time.
- This is capacity, not occupancy, and not every location has a page. Municipal crisis emergency shelters are missing. Say so on the page.

Part 3, population (CBS 37230ned, OData v4, no spaces in codes):
- Latest month: https://datasets.cbs.nl/odata/v1/CBS/37230ned/PeriodenCodes?$orderby=Identifier desc&$top=1
- Population at the start of the month: https://datasets.cbs.nl/odata/v1/CBS/37230ned/Observations?$filter=Measure eq 'M000098' and Perioden eq '<period>' and startswith(RegioS,'GM')&$select=RegioS,Value (rows with Value null are former municipalities).
- Names: https://datasets.cbs.nl/odata/v1/CBS/37230ned/RegioSCodes?$filter=startswith(Identifier,'GM'); strip " (gemeente)" from the end and join by name to the municipalities from part 2. Report municipalities that don't match.
- If opendata.cbs.nl (v3) returns 503: try later or stay with v4.

Output: at the top three key figures (residents now, change from a year earlier, permit holders) with the month. A line chart of occupancy since 2016 with permit holders as a second line. Bars of intake versus outflow per month. A sortable table per municipality: places, number of locations, places per 1,000 residents, province, with a search box. Under each part the source, the reference date and "rounded to tens". Use an honest User-Agent such as "my-project/1.0 (+you@example.com)" and store the fetched data as JSON, so the page doesn't call every source on each visit.
The core of the project in a small script. Needs: Node 20+ (fetch zit erin), geen pakketten. Tested on 2026-10-16; below is the real output of that run.
// Asielopvang: landelijke bezetting per maand (COA via data.overheid.nl), opvangplaatsen per gemeente
// (COA-locatiepagina's, via de index van opendataindex.nl) en plaatsen per 1.000 inwoners (CBS 37230ned).
// Node 20+, geen pakketten nodig: node asielopvang.mjs
const UA = { "User-Agent": "mijn-project/1.0 (+jij@voorbeeld.nl)" };
const ODI = "https://www.opendataindex.nl";
const nl = (n, d = 0) => n.toLocaleString("nl-NL", { minimumFractionDigits: d, maximumFractionDigits: d });

async function haal(url, soort = "json") {
  for (let poging = 1; ; poging++) {
    const r = await fetch(url, { headers: UA });
    if (r.ok) return soort === "json" ? r.json() : soort === "bytes" ? new Uint8Array(await r.arrayBuffer()) : r.text();
    if (poging === 3) throw new Error(`${r.status} bij ${url}`);
    await new Promise((ok) => setTimeout(ok, 2000 * poging));
  }
}
// De CSV's wisselen van codering: 2024 en 2025 UTF-8 (met BOM), de andere jaren Windows-1252.
function leesCsv(bytes) {
  let t;
  try { t = new TextDecoder("utf-8", { fatal: true }).decode(bytes); } catch { t = new TextDecoder("windows-1252").decode(bytes); }
  const [kop, ...rijen] = t.replace(/^/, "").trim().split(/\r?\n/).map((l) => l.split(";"));
  return rijen.map((x) => Object.fromEntries(kop.map((k, i) => [k.trim(), (x[i] ?? "").trim()])));
}
const waarde = (r) => Number(Object.values(r).at(-1)); // de laatste kolom is het aantal (naam verschilt per bestand)

// 1. Landelijk: de jaarbestanden staan als links op de datasetpagina (niet via /data/api: robots.txt verbiedt /data/).
const pagina = await haal("https://data.overheid.nl/dataset/immigratie-coa-opvang-en-onderdak-bezetting", "text");
// Sorteer op het jaartal in de bestandsnaam: 2016-2023 en 2024-2026 staan in verschillende mappen ("…2020_2.csv").
const jaar = (u) => u.match(/(20\d\d)(_\d)?\.csv$/)[1];
const csvs = [...new Set(pagina.match(/https:\/\/data\.overheid\.nl\/sites\/default\/files\/dataset\/[^"]+?\.csv/g))].sort((a, b) => jaar(a) - jaar(b));
const maanden = [];
let laatsteRijen = [];
for (const url of csvs) {
  const rijen = leesCsv(await haal(url, "bytes"));
  for (const r of rijen) if (r["Totaal van"] === "Jaar, Maand") maanden.push({ p: `${r.Jaar}-${r.Maand.padStart(2, "0")}`, v: waarde(r) });
  laatsteRijen = rijen;
}
maanden.sort((a, b) => a.p.localeCompare(b.p));
const nu = maanden.at(-1), laagste = maanden.reduce((a, b) => (b.v < a.v ? b : a));
const mnd = Number(nu.p.slice(5));
const deel = (kolom, w) => waarde(laatsteRijen.find((r) => r["Totaal van"] === `Jaar, Maand, ${kolom}` && Number(r.Maand) === mnd && r[kolom] === w));
console.log(`Bezetting COA-opvang ${nu.p}: ${nl(nu.v)} bewoners (${csvs.length} jaarbestanden, ${maanden.length} maanden)`);
console.log(`  laagste punt ${laagste.p}: ${nl(laagste.v)}; een jaar eerder (${maanden.at(-13).p}): ${nl(maanden.at(-13).v)}`);
console.log(`  waarvan vergunninghouders ${nl(deel("Vergunninghouder", "Vergunninghouder"))}, alleenstaande minderjarigen ${nl(deel("Amv", "Amv"))}`);

// 2. Opvangplaatsen per locatie: de boom van onze index (provincie > gemeente > locatie) en per locatie de datasetpagina.
const boom = async (pad) => haal(`${ODI}/api/catalogus/coa-locaties?pad=${encodeURIComponent(pad)}`);
const locaties = [];
for (const prov of (await boom("")).kinderen) {
  for (const gem of (await boom(prov.pad)).kinderen) {
    for (const it of (await boom(gem.pad)).items) locaties.push({ provincie: prov.titel, gemeente: gem.titel, sleutel: it.sleutel, titel: it.titel });
  }
}
async function inStukjes(lijst, n, f) { for (let i = 0; i < lijst.length; i += n) await Promise.all(lijst.slice(i, i + n).map(f)); }
await inStukjes(locaties, 4, async (l) => {
  const html = await haal(`${ODI}/dataset/coa-locaties/${l.sleutel}`, "text");
  const m = html.match(/<meta name="description" content="Capaciteit: (\d+)/);
  l.plaatsen = m ? Number(m[1]) : null; // tien pagina's noemen geen capaciteit: die tellen niet mee
});
const met = locaties.filter((l) => l.plaatsen);
const som = met.reduce((s, l) => s + l.plaatsen, 0);
console.log(`\nLocatiepagina's: ${locaties.length}, met capaciteit ${met.length}, samen ${nl(som)} plaatsen`);

// 3. Inwoners per gemeente: CBS 37230ned via OData v4 (datasets.cbs.nl), bevolking aan het begin van de nieuwste maand.
const V4 = "https://datasets.cbs.nl/odata/v1/CBS/37230ned";
const per = (await haal(`${V4}/PeriodenCodes?$orderby=Identifier desc&$top=1`)).value[0];
const obs = (await haal(`${V4}/Observations?$filter=${encodeURIComponent(`Measure eq 'M000098' and Perioden eq '${per.Identifier}' and startswith(RegioS,'GM')`)}&$select=RegioS,Value`)).value;
const codes = (await haal(`${V4}/RegioSCodes?$filter=${encodeURIComponent("startswith(Identifier,'GM')")}&$select=Identifier,Title`)).value;
const naam = Object.fromEntries(codes.map((c) => [c.Identifier, c.Title.replace(/ \(gemeente\)$/, "")]));
const inw = new Map(obs.filter((o) => o.Value != null).map((o) => [naam[o.RegioS], { gm: o.RegioS, n: o.Value }]));

const perGemeente = new Map();
for (const l of met) {
  const g = perGemeente.get(l.gemeente) ?? { plaatsen: 0, locaties: 0, provincie: l.provincie };
  g.plaatsen += l.plaatsen; g.locaties++; perGemeente.set(l.gemeente, g);
}
const tabel = [...perGemeente].map(([gemeente, g]) => ({ gemeente, ...g, ...inw.get(gemeente) }));
const zonder = tabel.filter((t) => !t.gm).map((t) => t.gemeente);
console.log(`Inwoners: CBS 37230ned, ${per.Title} (${per.Status}), ${inw.size} gemeenten; ${tabel.length} gemeenten met opvang${zonder.length ? `, niet gekoppeld: ${zonder.join(", ")}` : ""}`);
console.log("\nMeeste opvangplaatsen per 1.000 inwoners:");
for (const t of tabel.filter((t) => t.gm).sort((a, b) => b.plaatsen / b.n - a.plaatsen / a.n).slice(0, 10))
  console.log(`  ${t.gm} ${t.gemeente.padEnd(22)} ${String(t.plaatsen).padStart(5)} plaatsen  ${String(t.locaties).padStart(2)} loc.  ${nl(1000 * t.plaatsen / t.n, 1).padStart(5)} per 1.000`);
const totInw = [...inw.values()].reduce((s, x) => s + x.n, 0);
const provs = new Map(); for (const l of met) provs.set(l.provincie, (provs.get(l.provincie) ?? 0) + l.plaatsen);
console.log(`\nPer provincie: ${[...provs].sort((a, b) => b[1] - a[1]).map(([p, n]) => `${p} ${nl(n)}`).join(", ")}`);
console.log(`Landelijk: ${nl(1000 * som / totInw, 1)} plaatsen per 1.000 inwoners; ${342 - tabel.length} van de 342 gemeenten hebben geen COA-locatie met een pagina`);
Output
Bezetting COA-opvang 2026-09: 83.150 bewoners (11 jaarbestanden, 129 maanden)
  laagste punt 2018-06: 20.010; een jaar eerder (2025-09): 76.770
  waarvan vergunninghouders 18.300, alleenstaande minderjarigen 4.190

Locatiepagina's: 261, met capaciteit 251, samen 68.779 plaatsen
Inwoners: CBS 37230ned, 2026 augustus (Voorlopig), 342 gemeenten; 160 gemeenten met opvang

Meeste opvangplaatsen per 1.000 inwoners:
  GM1950 Westerwolde             2000 plaatsen   1 loc.   79,8 per 1.000
  GM1706 Cranendonck             1500 plaatsen   1 loc.   70,7 per 1.000
  GM0784 Gilze en Rijen          1200 plaatsen   1 loc.   42,4 per 1.000
  GM0629 Wassenaar                930 plaatsen   1 loc.   33,0 per 1.000
  GM0050 Zeewolde                 600 plaatsen   1 loc.   24,2 per 1.000
  GM0303 Dronten                 1000 plaatsen   1 loc.   21,9 per 1.000
  GM0376 Blaricum                 250 plaatsen   1 loc.   19,4 per 1.000
  GM0171 Noordoostpolder         1000 plaatsen   1 loc.   19,1 per 1.000
  GM1979 Eemsdelta                822 plaatsen   2 loc.   18,4 per 1.000
  GM0737 Tytsjerksteradiel        600 plaatsen   1 loc.   18,2 per 1.000

Per provincie: Zuid-Holland 13.086, Noord-Holland 13.055, Gelderland 8.236, Noord-Brabant 6.960, Groningen 4.130, Utrecht 3.900, Drenthe 3.798, Limburg 3.663, Flevoland 3.620, Overijssel 3.250, Fryslân 3.210, Zeeland 1.871
Landelijk: 3,8 plaatsen per 1.000 inwoners; 182 van de 342 gemeenten hebben geen COA-locatie met een pagina
Where it goes wrong
Mixed breakdowns: every CSV holds the monthly total and dozens of breakdowns (by status, country of origin, length of stay, type of reception, combinations). Always filter on one value of 'Totaal van'. Anyone who adds up all rows of a month gets a multiple of the real count.
Rounding to tens: details don't add up to the total. The countries of origin for September 2026 add up to 83,200, the total is 83,150; the 2026 intake months add up to 36,590, the year row is 36,570. Show the total rows and add 'rounded to tens' to every figure.
Encoding and spelling per year: 2024 and 2025 are UTF-8 with BOM, the rest Windows-1252. Read everything as UTF-8 and you get garbled names or an error. And country names change: 'Syrië' (2023) became 'Syrie' (2025, 2026), 'Bosnië-Herzegovina' became 'Bosnië en Herzegovina'. Normalise names before following a country across years.
Capacity is not occupancy: the location pages give the number of places, not how many people live there. Ter Apel has 2,000 places, but that says nothing about how full it is. And the sum of the pages (68,779) is not all reception: 261 pages against 329 locations according to the COA, plus municipal crisis emergency shelters that are not in it at all.
Text from a website: the term of the agreement is what the page says, and it can lag behind (Assen-Schepersmaat: 'expires on 1 April 2026', still online in October 2026). Show the date of our harvest and link to the location page on coa.nl.
Robots.txt and addresses: data.overheid.nl forbids /data/ (the CKAN API), so read the dataset page. api.pdok.nl forbids the Locatieserver: look up addresses with the BAG WFS on service.pdok.nl. The overview coa.nl/nl/locaties redirects to /nl/node/262, which returns 403: use the sitemap.
CBS codes and outages: the old OData v3 pads codes with spaces ('GM0363 ') and returned 503 for a while on 16 October 2026. The v4 on datasets.cbs.nl doesn't pad, but also returns former municipalities with Value null: filter them out, otherwise you divide by zero.
Take it further
Agreements that expire: read the sentence 'loopt tot <date>' or 'loopt af op <date>' from each location description and show per municipality how many places may disappear in the next two years.
Add asylum applications: CBS table 83102NED counts asylum applications per month and nationality. Put it next to the intake into reception per country of origin (after normalising country names).
Waiting for a home per municipality: put the national number of permit holders in reception (18,300 in September 2026) next to the housing target per municipality, and show how many homes are needed.
Map: every location in our index has a point from the BAG. Show the locations on a map with the PDOK municipal boundaries (pdok-wijkenbuurten) and colour municipalities by places per 1,000 residents.
More with this data
Permit holders in COA reception (with a residence permit, waiting for a home): 18,300 residents in september 2026, 21% more than in januari 2016
Permit holders in COA reception (with a residence permit, waiting for a home), januari 2016 – september 2026, in residents. The highest point was juni 2024 (20,390).
Source: Ministerie van Asiel en Migratie, Migratieketen: COA-opvang (data.overheid.nl, CC0) · opgehaald 25 oktober 2026 · selection: Alleen bewoners met een verblijfsvergunning (vergunninghouders); Aantallen afgerond op tientallenOpen the table Single block
Intake into COA reception: 51,660 people in 2025, 44% more than in 2016
Intake into COA reception, 2016 – 2025, in people. The highest point was 2023 (55,980).
Source: Ministerie van Asiel en Migratie, Migratieketen: COA-opvang (data.overheid.nl, CC0) · opgehaald 25 oktober 2026 · selection: Alleen volle jaren; Aantallen afgerond op tientallenOpen the table Single block
Residents of COA reception locations by country of origin: most Syrie (28,190 residents), then Eritrea and Irak
Residents of COA reception locations by country of origin, September 2026, in residents. Total: 83,150; the largest 12 of 119 categories are shown. Syrie is 34% of the total. Residents of COA locations by country of origin, September 2026. Country names as the ministry writes them (in Dutch); rounded to tens, countries with fewer than 5 residents are left out.
Source: Ministerie van Asiel en Migratie, Migratieketen: COA-opvang (data.overheid.nl, CC0) · opgehaald 25 oktober 2026Open the table Single block
Reception places at COA locations by province: most Zuid-Holland (13,086 places), then Noord-Holland and Gelderland
Reception places at COA locations by province, October 2026, in places. Total: 68,779; the largest 12 of 12 categories are shown. Zuid-Holland is 19% of the total. Reception places according to the 261 COA location pages (251 state a capacity), 68,779 places together. That is capacity, not how many people live there now. Crisis emergency shelters run by municipalities and safety regions are not included. Province from the address (BAG) and the 2025 municipal boundaries.
Source: COA, locatiepagina's op coa.nl (wekelijks gelezen door Open Data Index) · opgehaald 25 oktober 2026Open the table Single block
Reception places at COA locations by municipality: most Amsterdam (5,196 places), then Rotterdam and Westerwolde
Reception places at COA locations by municipality, October 2026, in places. Total: 68,779; the largest 12 of 160 categories are shown. Amsterdam is 8% of the total. Reception places according to the 261 COA location pages (251 state a capacity), 68,779 places together. That is capacity, not how many people live there now. Crisis emergency shelters run by municipalities and safety regions are not included. Municipality from the address (BAG) and the 2025 municipal boundaries.
Source: COA, locatiepagina's op coa.nl (wekelijks gelezen door Open Data Index) · opgehaald 25 oktober 2026Open the table Single block


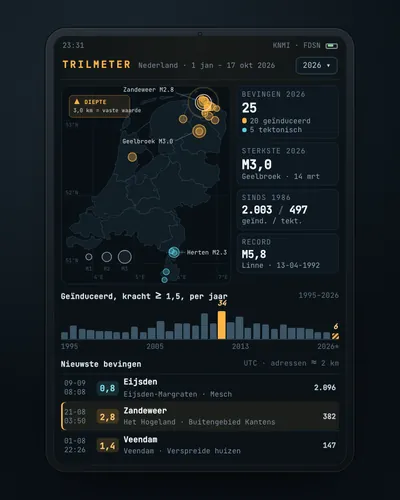 Earthquake tracker: every quake on the map, with municipality and homes
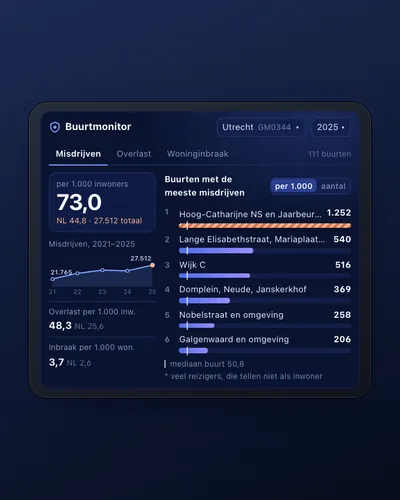 Neighbourhood safety monitor: nuisance and crime per neighbourhood
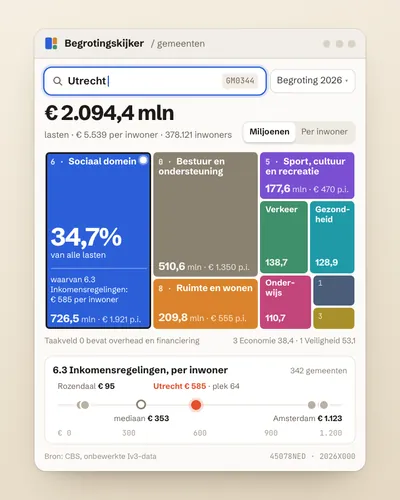 Municipal budget explorer: what does my municipality spend money on?
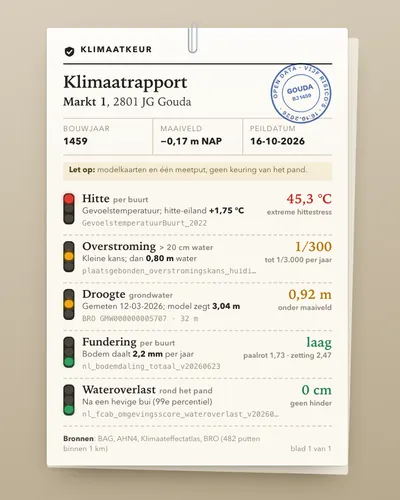 Climate risk check for an address
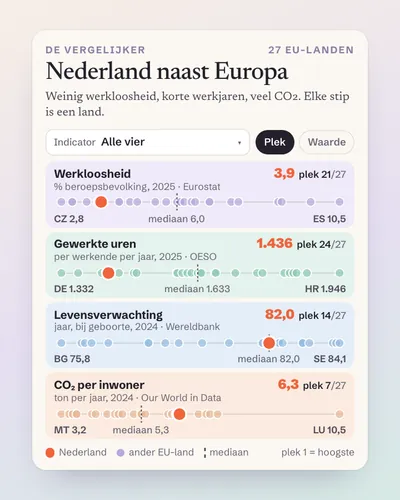 The Netherlands next to Europe: a comparison tool for any indicator
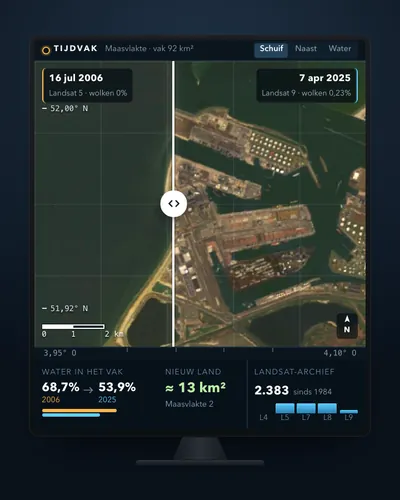 Satellite before and after: see how your town or polder changed