Solar panel check for your own roof
Type a postcode and house number and see how large your roof surfaces are, which way they face, how much sun falls on them and roughly what panels would yield, using open data from BAG, AHN, KNMI and RVO.
geef_project("zonnepanelen-check")geef_bron("pdok-bag")geef_bron("ahn")geef_bron("knmi-daggegevens")
I have the project, the tested calls and the pitfalls. I'll build a tool with Addresses and Buildings Register (BAG), Actueel Hoogtebestand Nederland (AHN, national elevation model), KNMI daily weather data and Heat potential maps (WarmteAtlas). This is how it could look:
You build this yourself. Copy the prompt into Claude, ChatGPT or Cursor, with the MCP server on, or follow the steps below.
Roof planes (AHN4)
- south39.445°
- north30.345°
- flat2.83°
- west2.354°
- east0.331°
Sun in De Bilt, kWh/m²
Enter your quote to see the payback time.
Estimate: shade and dormers are not included.
This is a mockup, not a working version, with the figures for Kamperfoeliestraat 1 in De Bilt from our test run on 16 October 2026 and KNMI radiation 2016–2025, fetched on 17 October 2026. Turn the MCP server on with the address on For AI.
Who it's for
Homeowners who want to know whether their roof is suitable, energy cooperatives and municipalities that want to assess a street or neighbourhood, and developers who want a first estimate without a paid service.
What you get
A small tool that shows four things for an address: the building from the BAG, the shape of the roof from the AHN4 elevation model (roof surfaces per direction with their pitch and area), the solar radiation at the nearest KNMI station and a rough estimate of what panels would yield. Next to that, the average electricity use per home in the neighbourhood from the RVO potential map, so you have something to compare the yield with.
Test run on 16 October 2026 with Kamperfoeliestraat 1 in De Bilt (building from 1987, footprint 68.1 m²): a gable roof of about 45 degrees with 39.4 m² of roof facing south and 30.3 m² facing north, ridge 9.1 metres above ground level (2.90 m NAP). The KNMI station De Bilt is 0.6 km away and measured 1,211 kWh of solar radiation per m² on a flat surface in 2025; the average over 2016 to 2025 was 1,100 kWh/m² (lowest 1,020 in 2017, highest 1,211 in 2025). With rules of thumb (70% of the south surface usable, panels with 21% efficiency, performance ratio 0.8) that comes to about 28 m² of panels, roughly 5.8 kWp and around 5,600 kWh per year. According to the RVO map (2014 figures), households in the neighbourhood De Bilt used about 3,050 kWh of electricity per home per year.
This is an estimate, not a quote: shade from trees and neighbours, the exact roof pitch, dormers and the panel type are not properly included.
Solar radiation on a flat surface in De Bilt (KNMI measurements): an average of 1,038 kWh per m² a year in 1996–2025, 8% more than in 1958–1987
Solar radiation on a flat surface in De Bilt (KNMI measurements), 1958 – 2025, in kWh per m² a year. That is the highest point in the series.
How you could start7 steps
- 1
1. From address to address object (BAG WFS)
Look up the address in the PDOK BAG WFS with a filter on postcode and house number. You get the address object with a point in RD coordinates (EPSG:28992), the construction year and the building ID. Do not use the PDOK Locatieserver: robots.txt of api.pdok.nl excludes /bzk/locatieserver/*. Watch out for house letters and additions: with 12A and 12B you get more than one object, so also filter on huisletter or toevoeging.
https://service.pdok.nl/lv/bag/wfs/v2_0?service=WFS&version=2.0.0&request=GetFeature&typeNames=bag:verblijfsobject&outputFormat=application/json&srsName=EPSG:28992&filter=<Filter><And><PropertyIsEqualTo><PropertyName>postcode</PropertyName><Literal>3732VT</Literal></PropertyIsEqualTo><PropertyIsEqualTo><PropertyName>huisnummer</PropertyName><Literal>1</Literal></PropertyIsEqualTo></And></Filter>
"numberMatched": 1, "features": [ { "type": "Feature", "properties": { "identificatie": "0310010000683233", "oppervlakte": 123, "status": "Verblijfsobject in gebruik", "gebruiksdoel": "woonfunctie", "openbare_ruimte": "Kamperfoeliestraat", "huisnummer": 1, "huisletter": "", "toevoeging": "", "postcode": "3732VT", "woonplaats": "De Bilt", "bouwjaar": 1987, "pandidentificatie": "0310100000667094", "pandstatus": "Pand in gebruik" }, "geometry": { "type": "Point", "coordinates": [ 141103.0, 457452.0 ] } } - 2
2. The outline of the building
Use the building ID to fetch the building. The polygon is the outline of the building on the ground (in metres, RD). From it you compute the footprint (shoelace formula: 68.1 m² here) and later cut out the elevation model. Note: a building can have several addresses (aantal_verblijfsobjecten), for example a block of flats; the roof is then shared.
https://service.pdok.nl/lv/bag/wfs/v2_0?service=WFS&version=2.0.0&request=GetFeature&typeNames=bag:pand&outputFormat=application/json&srsName=EPSG:28992&filter=<Filter><PropertyIsEqualTo><PropertyName>identificatie</PropertyName><Literal>0310100000667094</Literal></PropertyIsEqualTo></Filter>
{ "type": "Feature", "properties": { "identificatie": "0310100000667094", "bouwjaar": 1987, "status": "Pand in gebruik", "gebruiksdoel": "woonfunctie", "oppervlakte_min": 123, "oppervlakte_max": 123, "aantal_verblijfsobjecten": 1 }, "bbox": [ 141098.73, 457448.896, 141109.192, 457462.932 ], "geometry": { "type": "Polygon", "coordinates": [ [ [ 141102.413, 457460.394 ], [ 141098.73, 457451.005 ], [ 141104.106, 457448.896 ], [ 141109.192, 457462.016 ], [ 141106.857, 457462.932 ], [ 141105.401, 457459.222 ], [ 141102.413, 457460.394 ] ] ] } } - 3
3. One quick height: AHN GetFeatureInfo (and why that is not enough)
A WMS GetFeatureInfo on the layer dsm_05m (surface including buildings) returns the height in metres NAP. Use a bbox of 200 by 200 metres with 200 pixels and click in the middle (i=j=100); with a very small bbox you get an empty list. Two pitfalls: the service returns the nearest cell that has a value, with its own coordinates (here 141101.75; 457454.25, more than 2 metres from the requested point), and the terrain model dtm_05m has no value under buildings. For the shape of a roof you therefore need the raster itself (step 4).
https://service.pdok.nl/rws/ahn/wms/v1_0?service=WMS&version=1.3.0&request=GetFeatureInfo&layers=dsm_05m&query_layers=dsm_05m&styles=&crs=EPSG:28992&bbox=141003,457352,141203,457552&width=200&height=200&i=100&j=100&info_format=application/json
{"type":"FeatureCollection","features":[{"type":"Feature","bbox":[141101.75,457454.25,141101.75,457454.25], "geometry":{"type":"Point","coordinates":[141101.75,457454.25]},"properties":{"value_list":"9.61400032"}}], "crs":{"properties":{"name":"urn:ogc:def:crs:EPSG::28992"},"type":"name"}} - 4
4. The roof as a raster: AHN WCS GetCoverage
Use WCS to cut out a rectangle around the building (bbox of the polygon plus 3 metres), once from dsm_05m (roof) and once from dtm_05m (ground around it). You get a GeoTIFF with 0.5 metre cells, float32. It is compressed with deflate and a floating point predictor (Predictor 3): GDAL, rasterio or geotiff.js read it as is, your own reader has to add up the bytes per row first and then de-interleave them (see the script). Empty cells have the value 3.4028235e38. Compute slope and compass direction per roof cell from its neighbours, drop cells steeper than 60 degrees (roof edges and walls) and add up the sloped area per direction (0.25 m² divided by the cosine of the slope).
https://service.pdok.nl/rws/ahn/wcs/v1_0?service=WCS&version=2.0.1&request=GetCoverage&coverageId=dsm_05m&subset=x(141095,141113)&subset=y(457445,457466)&format=image/tiff
HTTP/1.1 200 OK
Content-Length: 5041
Content-Type: image/tiff
(TIFF-kop, uitgelezen: breedte 36, hoogte 42 cellen, RowsPerStrip 42,
 Compression 8 = deflate, Predictor 3 = floating point, SampleFormat 3 = float)
- 5
5. Solar radiation from the nearest KNMI station
The KNMI daily data have the global radiation Q per station in J/cm² per day: the sun on a flat surface. Divide by 360 to get kWh per m² (1 kWh is 3.6 million joules, 1 m² is 10,000 cm²). First request all stations without fmt: the text version starts with a list of stations with longitude and latitude, so you can pick the nearest. Not every station measures radiation: in 2025, 31 of the 48 stations had a full year of Q. Then fetch ten years from that station, because one year says little: 2025 was the sunniest of the ten in De Bilt.
curl -X POST "https://www.daggegevens.knmi.nl/klimatologie/daggegevens" \
  -d 'stns=260&vars=Q&start=20250101&end=20251231&fmt=json'
[{"station_code":260,"date":"2025-01-01T00:00:00.000Z","Q":38}, {"station_code":260,"date":"2025-01-02T00:00:00.000Z","Q":328}, {"station_code":260,"date":"2025-01-03T00:00:00.000Z","Q":156}, ... {"station_code":260,"date":"2025-12-31T00:00:00.000Z","Q":276}] (365 dagen, som 436.112 J/cm² = 1.211 kWh/m²) - 6
6. The station list with coordinates
Without fmt you get text with comment lines. These list every station with LON and LAT. Convert the RD point of the address to degrees (or request the address object with srsName=EPSG:4326; the GeoJSON then gives longitude, latitude) and pick the nearest station that has a full year of Q.
curl -X POST "https://www.daggegevens.knmi.nl/klimatologie/daggegevens" \
  -d 'stns=ALL&vars=Q&start=20251001&end=20251001'
# STN         LON(east)   LAT(north)  ALT(m)      NAME
# 209         4.518       52.465      0.00        IJmond
# 210         4.430       52.171      -0.20       VALKENBURG VK
# 260         5.180       52.100      1.90        De Bilt
# 265         5.274       52.130      13.90       Soesterberg
...
# Q         : Globale straling (in J/cm2) / Global radiation (in J/cm2)
# STN,YYYYMMDD,    Q
  209,20251001,
- 7
7. Electricity use in the neighbourhood (RVO potential map)
The RVO ambient heat potential map has, per neighbourhood, the number of homes, the area and the electricity and heat use of households, plus the potential for ground source heat (WKO). Request the neighbourhood with a small bbox around the address in RD (bbox-crs). Note: the figures are from 2014 with the 2014 neighbourhood boundaries, and the API gives no units. The consumption fields are in the same unit as the potentials (GJ per hectare per year): 75.68 × 584 ha / 4,026 homes = 11.0 GJ = about 3,050 kWh per home, a plausible household figure. Use it as a reference point, not as your own consumption.
https://api.pdok.nl/rvo/potentiekaart-omgevingswarmte/ogc/v1/collections/warmtegeslotenwkobuurt/items?f=json&bbox=141102,457451,141104,457453&bbox-crs=http://www.opengis.net/def/crs/EPSG/0/28992&limit=5
{"aantal_huishoudens_buurt": 4025, "aantal_inwoners_buurt": 8755, "aantal_woningen": 4026,
 "buurtnaam": "De Bilt", "cbs_buurtcode_1": "BU03100008", "gemeentenaam": "De Bilt", "jaar": 2014,
 "opp_land_totaal": 584, "potentieel_warmte_gesloten_wko": 1600, "potentieel_warmte_open_wko": 1900,
 "verbruik_elektra_huishoudens": 75.675514, "verbruik_warmte_huishoudens": 294.483198, ...}
How the sources fit together
- Addresses and Buildings Register (BAG)Actueel Hoogtebestand Nederland (AHN, national elevation model)via
pandpolygoon in RD (EPSG:28992)BAG and AHN both use RD coordinates in metres. The bbox of the building polygon decides which part of the raster you fetch; a point-in-polygon test keeps only the roof cells, and the cells outside give the ground level.
- Addresses and Buildings Register (BAG)KNMI daily weather datavia
coördinaat van het adres → dichtstbijzijnde station met stralingConvert the RD point to longitude and latitude and pick the nearest KNMI station that measures Q. In De Bilt that is station 260 at 0.6 km; elsewhere it can be 20 km or more, and the coast gets more sun than inland.
- Actueel Hoogtebestand Nederland (AHN, national elevation model)KNMI daily weather datavia
dakrichting en helling × straling op een plat vlakKNMI measures radiation on a flat surface. A south-facing roof at 30 to 45 degrees catches more, an east or west roof less. The script uses fixed factors as a rule of thumb; for precise figures per pitch and orientation you need a radiation model.
- Addresses and Buildings Register (BAG)Heat potential maps (WarmteAtlas)via
punt in buurtvlak (bbox met bbox-crs EPSG:28992), buurtcode van 2014The RVO neighbourhoods use the 2014 boundaries. Look them up with the point of the address, not with the current neighbourhood code from BAG or CBS: that may have changed since.
Let AI build it
Paste this prompt into Claude, ChatGPT, Cursor or Lovable. It names the real endpoints, the join keys and the pitfalls, so the assistant writes working code straight away. Always check the result against the source itself.
Build a web tool (Node/TypeScript backend + simple frontend, or Python with FastAPI) where I type a postcode and house number and see how suitable my roof is for solar panels and roughly what they would yield. All sources are open and need no key. Send an honest User-Agent with every request, such as "my-solar-project/1.0 (+you@example.com)".

Step 1, address to building (BAG via the PDOK WFS, not the Locatieserver: robots.txt of api.pdok.nl excludes it):
https://service.pdok.nl/lv/bag/wfs/v2_0?service=WFS&version=2.0.0&request=GetFeature&typeNames=bag:verblijfsobject&outputFormat=application/json&srsName=EPSG:28992&filter=<Filter><And><PropertyIsEqualTo><PropertyName>postcode</PropertyName><Literal>3732VT</Literal></PropertyIsEqualTo><PropertyIsEqualTo><PropertyName>huisnummer</PropertyName><Literal>1</Literal></PropertyIsEqualTo></And></Filter>
- Fields: identificatie, postcode, huisnummer, huisletter, toevoeging, bouwjaar, pandidentificatie, geometry (point in RD).
- More than one hit with house letters or additions (12A, 12B): let the user choose or filter on huisletter/toevoeging.
- Then the building: typeNames=bag:pand with a filter on identificatie = pandidentificatie. The geometry is the footprint polygon; aantal_verblijfsobjecten > 1 means a shared roof (flats): show that.

Step 2, roof shape from AHN4 (PDOK WCS, 0.5 m cells, CC0):
https://service.pdok.nl/rws/ahn/wcs/v1_0?service=WCS&version=2.0.1&request=GetCoverage&coverageId=dsm_05m&subset=x(141095,141113)&subset=y(457445,457466)&format=image/tiff
- Use the bbox of the building polygon plus 3 metres. Fetch dsm_05m (roof) and dtm_05m (ground).
- The GeoTIFF is float32, deflate, Predictor 3 (floating point). Use geotiff.js or rasterio; reading it yourself also works (add up the bytes per row cumulatively, then take each cell's 4 bytes from 4 blocks of width w, big-endian).
- Nodata = 3.4028235e38. The DTM is empty under buildings: use the median of the DTM cells outside the polygon as ground level.
- Per roof cell inside the polygon: slope and compass direction from the four neighbours (dz/dx and dz/dy, y points north). Drop cells steeper than 60 degrees (edges, walls). Classes: flat (< 10 degrees), south (135 to 225), east (45 to 135), west (225 to 315), north. Sloped area per cell = 0.25 / cos(slope).
- WMS GetFeatureInfo is not suitable for the roof shape: it returns the nearest cell with a value, sometimes metres away from the requested point.
- The DSM is the highest point: overhanging trees count as roof. AHN4 was captured in 2020 to 2022: newer dormers or extensions are missing.

Step 3, solar radiation (KNMI daily data, POST, CC BY 4.0):
POST https://www.daggegevens.knmi.nl/klimatologie/daggegevens with body stns=ALL&vars=Q&start=20250101&end=20251231 (without fmt: text with a station list LON/LAT in the header).
- Q is global radiation in J/cm² per day on a flat surface; kWh/m² = Q / 360.
- Not every station measures Q (31 of 48 had a full year in 2025). Pick the nearest station with at least 360 days.
- Then fetch ten years for that station (fmt=json, start=20160101, end=20251231) and use the average; also show the highest and lowest year. In De Bilt: 1,100 kWh/m² on average, 1,020 to 1,211.
- Raw station series: not homogenised, not meant for trends.

Step 4, yield as an estimate (make the assumptions adjustable and show them on screen):
yield (kWh/year) = radiation (kWh/m²) × orientation factor × panel area (m²) × efficiency × performance ratio
- Defaults: efficiency 0.21, performance ratio 0.8, 70% of a roof surface usable, orientation factor south 1.1, east and west 0.9, flat 1.0, north not counted. These are rules of thumb, not measurements.
- Show kWp (panel area × efficiency) and kWh per year, rounded. Clearly label it "estimate" and say shade is not included.
- PVGIS (JRC) calculates this more precisely, but robots.txt of re.jrc.ec.europa.eu forbids all automated requests: only link to the web tool, do not call the API.

Step 5, consumption reference (RVO potential map, CC0):
https://api.pdok.nl/rvo/potentiekaart-omgevingswarmte/ogc/v1/collections/warmtegeslotenwkobuurt/items?f=json&bbox=<x-1>,<y-1>,<x+1>,<y+1>&bbox-crs=http://www.opengis.net/def/crs/EPSG/0/28992&limit=1
- Electricity per home (kWh) = verbruik_elektra_huishoudens × opp_land_totaal × 1e9 / 3.6e6 / aantal_woningen. The API gives no unit; GJ per hectare per year gives plausible results (~3,050 kWh in De Bilt).
- Figures and neighbourhood boundaries from 2014. Say so.

Output: one page with the address, a plan of the roof coloured by direction, a table of roof surfaces (direction, pitch, m²), the radiation at the chosen station (average and range), the estimated kWp and kWh per year, and the neighbourhood consumption for comparison. Attribution: Kadaster/PDOK (BAG), AHN via PDOK, KNMI, RVO.
Try it yourself
The core of the project in a small script. Needs: Node 20+ (fetch en zlib zitten erin, geen pakketten nodig). Opslaan als zon.mjs, draaien met: node zon.mjs 3732VT 1. Tested on 2026-10-16; below is the real output of that run.
// Zonnepanelen-check: hoeveel zon valt er op je dak en wat levert het ruwweg op?
// Bronnen: BAG (PDOK WFS), AHN4 (PDOK WCS), KNMI daggegevens (globale straling Q), RVO-potentiekaart (buurt).
// Node 20+, geen pakketten nodig. Gebruik: node zon.mjs 3732VT 1
import { inflateSync } from "node:zlib";

const UA = { "User-Agent": "mijn-zonproject/1.0 (+jij@voorbeeld.nl)" };
const [POSTCODE = "3732VT", HUISNUMMER = "1"] = process.argv.slice(2);
const JAAR = 2025; // laatste volle jaar

// Aannames (vuistregels, geen metingen): pas ze aan voor jouw situatie.
const RENDEMENT = 0.21;       // moderne panelen: ~21% van het licht wordt stroom (≈ 0,21 kWp per m² paneel)
const PRESTATIE = 0.8;        // prestatiefactor: verlies door omvormer, kabels, warmte, vuil
const BRUIKBAAR = 0.7;        // deel van een geschikt dakvlak waar echt panelen passen (randen, schoorsteen, dakraam)
const FACTOR = { zuid: 1.1, oost: 0.9, west: 0.9, plat: 1.0 }; // straling op het paneel t.o.v. een plat vlak

const get = async (url, opts = {}) => {
  const r = await fetch(url, { ...opts, headers: { ...UA, ...(opts.headers ?? {}) } });
  if (!r.ok) throw new Error(`${r.status} ${url}`);
  return r;
};
const fes = (filters) => "<Filter>" + (filters.length > 1 ? "<And>" : "") +
  filters.map(([k, v]) => `<PropertyIsEqualTo><PropertyName>${k}</PropertyName><Literal>${v}</Literal></PropertyIsEqualTo>`).join("") +
  (filters.length > 1 ? "</And>" : "") + "</Filter>";
const wfs = async (laag, filters) => {
  const u = new URL("https://service.pdok.nl/lv/bag/wfs/v2_0");
  Object.entries({ service: "WFS", version: "2.0.0", request: "GetFeature", typeNames: laag,
    outputFormat: "application/json", srsName: "EPSG:28992", filter: fes(filters) }).forEach(([k, v]) => u.searchParams.set(k, v));
  return (await (await get(u)).json()).features;
};

// 1. Adres → verblijfsobject → pand (BAG-WFS; de Locatieserver is in robots.txt uitgesloten)
const [vbo] = await wfs("bag:verblijfsobject", [["postcode", POSTCODE.toUpperCase().replace(/\s/g, "")], ["huisnummer", HUISNUMMER]]);
if (!vbo) throw new Error("adres niet gevonden");
const a = vbo.properties;
const [pand] = await wfs("bag:pand", [["identificatie", a.pandidentificatie]]);
const ring = pand.geometry.coordinates[0];
let opp = 0;
for (let i = 0; i < ring.length - 1; i++) opp += ring[i][0] * ring[i + 1][1] - ring[i + 1][0] * ring[i][1];
console.log(`${a.openbare_ruimte} ${a.huisnummer}${a.huisletter}, ${a.postcode} ${a.woonplaats}`);
console.log(`  pand ${a.pandidentificatie}, bouwjaar ${pand.properties.bouwjaar}, ${pand.properties.aantal_verblijfsobjecten} adres(sen) in het pand`);
console.log(`  grondvlak volgens BAG-omtrek: ${Math.abs(opp / 2).toFixed(1)} m²`);

// 2. AHN4: oppervlakte (DSM) en maaiveld (DTM) rond het pand, 0,5 m cellen, GeoTIFF met deflate + float-predictor
function leesTiff(buf) {
  const dv = new DataView(buf.buffer, buf.byteOffset, buf.byteLength);
  const tags = {};
  const n = dv.getUint16(dv.getUint32(4, true), true);
  for (let i = 0; i < n; i++) {
    const p = dv.getUint32(4, true) + 2 + i * 12;
    const tag = dv.getUint16(p, true), type = dv.getUint16(p + 2, true), cnt = dv.getUint32(p + 4, true);
    const size = { 3: 2, 4: 4, 12: 8 }[type] ?? 1;
    const off = cnt * size > 4 ? dv.getUint32(p + 8, true) : p + 8;
    tags[tag] = Array.from({ length: cnt }, (_, k) =>
      type === 3 ? dv.getUint16(off + 2 * k, true) : type === 4 ? dv.getUint32(off + 4 * k, true) : type === 12 ? dv.getFloat64(off + 8 * k, true) : dv.getUint8(off + k));
  }
  const w = tags[256][0], h = tags[257][0], rps = tags[278]?.[0] ?? h;
  if (tags[322]) throw new Error("tegel-TIFF niet ondersteund");
  const waarden = new Float32Array(w * h);
  tags[273].forEach((off, s) => {
    let ruw = buf.subarray(off, off + tags[279][s]);
    if (tags[259][0] === 8) ruw = inflateSync(ruw);
    for (let r = 0; r < rps && s * rps + r < h; r++) {
      const rij = Uint8Array.from(ruw.subarray(r * w * 4, (r + 1) * w * 4));
      if (tags[317]?.[0] === 3) {             // floating point predictor: bytes optellen, dan ontvlechten
        for (let k = 1; k < rij.length; k++) rij[k] = (rij[k] + rij[k - 1]) & 255;
        for (let c = 0; c < w; c++)
          waarden[(s * rps + r) * w + c] = new DataView(Uint8Array.of(rij[c], rij[w + c], rij[2 * w + c], rij[3 * w + c]).buffer).getFloat32(0, false);
      } else for (let c = 0; c < w; c++) waarden[(s * rps + r) * w + c] = new DataView(rij.buffer).getFloat32(c * 4, true);
    }
  });
  const [sx, sy] = tags[33550], tp = tags[33922];
  return { w, h, waarden, x0: tp[3], y0: tp[4], sx, sy };
}
const xs = ring.map((p) => p[0]), ys = ring.map((p) => p[1]);
const bb = [Math.floor(Math.min(...xs)) - 3, Math.floor(Math.min(...ys)) - 3, Math.ceil(Math.max(...xs)) + 3, Math.ceil(Math.max(...ys)) + 3];
const wcs = async (laag) => {
  const r = await get(`https://service.pdok.nl/rws/ahn/wcs/v1_0?service=WCS&version=2.0.1&request=GetCoverage&coverageId=${laag}` +
    `&subset=x(${bb[0]},${bb[2]})&subset=y(${bb[1]},${bb[3]})&format=image/tiff`);
  return leesTiff(Buffer.from(await r.arrayBuffer()));
};
const dsm = await wcs("dsm_05m"), dtm = await wcs("dtm_05m");
const binnen = (x, y) => { let ja = false; for (let i = 0, j = ring.length - 1; i < ring.length; j = i++) {
  const [xi, yi] = ring[i], [xj, yj] = ring[j];
  if ((yi > y) !== (yj > y) && x < ((xj - xi) * (y - yi)) / (yj - yi) + xi) ja = !ja; } return ja; };
const geldig = (v) => v < 1e30;
const mediaan = (l) => { const s = [...l].sort((p, q) => p - q); return s[Math.floor(s.length / 2)]; };
const grond = [], dak = [];
for (let r = 1; r < dsm.h - 1; r++) for (let c = 1; c < dsm.w - 1; c++) {
  const x = dsm.x0 + (c + 0.5) * dsm.sx, y = dsm.y0 - (r + 0.5) * dsm.sy, i = r * dsm.w + c;
  if (!binnen(x, y)) { if (geldig(dtm.waarden[i])) grond.push(dtm.waarden[i]); continue; }
  const z = (rr, cc) => dsm.waarden[rr * dsm.w + cc];
  if (![z(r, c), z(r, c - 1), z(r, c + 1), z(r - 1, c), z(r + 1, c)].every(geldig)) continue;
  const dzdx = (z(r, c + 1) - z(r, c - 1)) / (2 * dsm.sx), dzdy = (z(r - 1, c) - z(r + 1, c)) / (2 * dsm.sy); // y naar noord
  const helling = (Math.atan(Math.hypot(dzdx, dzdy)) * 180) / Math.PI;
  const richting = ((Math.atan2(-dzdx, -dzdy) * 180) / Math.PI + 360) % 360; // kompasrichting waar het vlak naar kijkt
  dak.push({ z: z(r, c), helling, richting });
}
const maaiveld = mediaan(grond);
const randloos = dak.filter((d) => d.helling < 60); // steile cellen zijn dakranden en gevels
const klas = (d) => d.helling < 10 ? "plat" : d.richting >= 135 && d.richting < 225 ? "zuid" : d.richting >= 45 && d.richting < 135 ? "oost"
  : d.richting >= 225 && d.richting < 315 ? "west" : "noord";
const vlakken = {};
for (const d of randloos) { const k = klas(d); (vlakken[k] ??= { cellen: 0, opp: 0, helling: [] }); vlakken[k].cellen++;
  vlakken[k].opp += (dsm.sx * dsm.sy) / Math.cos((d.helling * Math.PI) / 180); vlakken[k].helling.push(d.helling); }
console.log(`\nAHN4 (2020-2022): maaiveld ${maaiveld.toFixed(2)} m NAP, nok ${(Math.max(...dak.map((d) => d.z)) - maaiveld).toFixed(1)} m boven maaiveld, ${dak.length} dakcellen van 0,5 m`);
for (const [k, v] of Object.entries(vlakken).sort((p, q) => q[1].opp - p[1].opp))
  console.log(`  ${k.padEnd(5)} ${v.opp.toFixed(1).padStart(6)} m² dakvlak, helling ~${mediaan(v.helling).toFixed(0)}°`);

// 3. KNMI: globale straling Q (J/cm² per dag) van het dichtstbijzijnde station dat Q meet; kWh/m² = Q / 360
const tekst = await (await get("https://www.daggegevens.knmi.nl/klimatologie/daggegevens", { method: "POST",
  headers: { "Content-Type": "application/x-www-form-urlencoded" }, body: `stns=ALL&vars=Q&start=${JAAR}0101&end=${JAAR}1231` })).text();
const stations = {}, som = {}, dagen = {};
for (const regel of tekst.split("\n")) {
  const m = regel.match(/^# (\d{3})\s+([\d.]+)\s+([\d.]+)\s+\S+\s+(.+?)\s*$/);
  if (m) stations[m[1]] = { lon: +m[2], lat: +m[3], naam: m[4] };
  const d = regel.match(/^\s*(\d{3}),\d{8},\s*(\d+)\s*$/);
  if (d) { som[d[1]] = (som[d[1]] ?? 0) + +d[2]; dagen[d[1]] = (dagen[d[1]] ?? 0) + 1; }
}
// RD → graden (benadering van Schreutelkamp en Strang van Hees, nauwkeurig tot ~1 m)
const [X, Y] = vbo.geometry.coordinates, dX = (X - 155000) * 1e-5, dY = (Y - 463000) * 1e-5;
const lat = 52.1551744 + (3235.65389 * dY - 32.58297 * dX ** 2 - 0.2475 * dY ** 2 - 0.84978 * dX ** 2 * dY - 0.0655 * dY ** 3 - 0.01709 * dX ** 2 * dY ** 2 + 0.00738 * dX + 0.0053 * dX ** 4) / 3600;
const lon = 5.38720621 + (5260.52916 * dX + 105.94684 * dX * dY + 2.45656 * dX * dY ** 2 - 0.81885 * dX ** 3 + 0.05594 * dX * dY ** 3 - 0.05607 * dX ** 3 * dY + 0.01199 * dY - 0.00256 * dX ** 3 * dY ** 2) / 3600;
const km = (s) => Math.hypot((s.lon - lon) * 111.32 * Math.cos((lat * Math.PI) / 180), (s.lat - lat) * 110.57);
const [stn] = Object.keys(som).filter((s) => dagen[s] >= 360).sort((p, q) => km(stations[p]) - km(stations[q]));
// Tien jaar van dat station: een zonnig jaar is geen gewoon jaar
const reeks = await (await get("https://www.daggegevens.knmi.nl/klimatologie/daggegevens", { method: "POST",
  headers: { "Content-Type": "application/x-www-form-urlencoded" }, body: `stns=${stn}&vars=Q&start=${JAAR - 9}0101&end=${JAAR}1231&fmt=json` })).json();
const perJaar = {};
for (const r of reeks) if (r.Q != null) perJaar[r.date.slice(0, 4)] = (perJaar[r.date.slice(0, 4)] ?? 0) + r.Q / 360;
const jaren = Object.values(perJaar), kwh = jaren.reduce((p, q) => p + q, 0) / jaren.length;
const [laag, hoog] = [Math.min(...jaren), Math.max(...jaren)].map(Math.round);
console.log(`\nKNMI ${stations[stn].naam.trim()} (${stn}, ${km(stations[stn]).toFixed(1)} km): zon op een plat vlak`);
console.log(`  ${JAAR}: ${Math.round(som[stn] / 360)} kWh/m², gemiddeld ${JAAR - 9}-${JAAR}: ${Math.round(kwh)} kWh/m² (${laag} tot ${hoog})`);

// 4. Ruwe schatting van de opbrengst (vuistregels hierboven; geen schaduw van bomen of buren meegerekend)
let totaal = 0;
console.log(`\nSchatting met het gemiddelde jaar (rendement ${RENDEMENT}, prestatiefactor ${PRESTATIE}, ${BRUIKBAAR * 100}% van het dakvlak):`);
for (const [k, v] of Object.entries(vlakken)) {
  if (!(k in FACTOR) || v.opp < 5) continue;
  const m2 = v.opp * BRUIKBAAR, kwp = m2 * RENDEMENT, opbrengst = kwh * FACTOR[k] * m2 * RENDEMENT * PRESTATIE;
  totaal += opbrengst;
  console.log(`  ${k.padEnd(5)} ${m2.toFixed(0).padStart(3)} m² panelen (~${kwp.toFixed(1)} kWp) -> ~${Math.round(opbrengst / 10) * 10} kWh per jaar`);
}
console.log(`  samen ~${Math.round(totaal / 100) * 100} kWh per jaar (schatting)`);

// 5. RVO-potentiekaart: stroomverbruik van huishoudens in de buurt (cijfers 2014, GJ per ha land per jaar)
const rvo = await (await get(`https://api.pdok.nl/rvo/potentiekaart-omgevingswarmte/ogc/v1/collections/warmtegeslotenwkobuurt/items?f=json` +
  `&bbox=${X - 1},${Y - 1},${X + 1},${Y + 1}&bbox-crs=http://www.opengis.net/def/crs/EPSG/0/28992&limit=1`)).json();
const b = rvo.features[0]?.properties;
if (b) {
  const perWoning = (b.verbruik_elektra_huishoudens * b.opp_land_totaal * 1e9) / 3.6e6 / b.aantal_woningen;
  console.log(`\nRVO-buurt ${b.buurtnaam} (${b.cbs_buurtcode_1}, indeling ${b.jaar}): ~${Math.round(perWoning)} kWh stroom per woning per jaar`);
  console.log(`  bodemwarmte gesloten WKO: ${b.potentieel_warmte_gesloten_wko} GJ/ha/jaar, warmteverbruik huishoudens ${Math.round(b.verbruik_warmte_huishoudens)} GJ/ha/jaar`);
}
Kamperfoeliestraat 1, 3732VT De Bilt
  pand 0310100000667094, bouwjaar 1987, 1 adres(sen) in het pand
  grondvlak volgens BAG-omtrek: 68.1 m²

AHN4 (2020-2022): maaiveld 2.90 m NAP, nok 9.1 m boven maaiveld, 272 dakcellen van 0,5 m
  zuid    39.4 m² dakvlak, helling ~45°
  noord   30.3 m² dakvlak, helling ~45°
  plat     2.8 m² dakvlak, helling ~3°
  west     2.3 m² dakvlak, helling ~54°
  oost     0.3 m² dakvlak, helling ~31°

KNMI De Bilt (260, 0.6 km): zon op een plat vlak
  2025: 1211 kWh/m², gemiddeld 2016-2025: 1100 kWh/m² (1020 tot 1211)

Schatting met het gemiddelde jaar (rendement 0.21, prestatiefactor 0.8, 70% van het dakvlak):
  zuid   28 m² panelen (~5.8 kWp) -> ~5600 kWh per jaar
  samen ~5600 kWh per jaar (schatting)

RVO-buurt De Bilt (BU03100008, indeling 2014): ~3049 kWh stroom per woning per jaar
  bodemwarmte gesloten WKO: 1600 GJ/ha/jaar, warmteverbruik huishoudens 294 GJ/ha/jaar
Where it goes wrong
- Do not use the PDOK Locatieserver to look up addresses: robots.txt of api.pdok.nl excludes /bzk/locatieserver/*. The BAG WFS with an FES filter on postcode and house number does work and returned the address in a fraction of a second. With house letters and additions you get more than one object.
- AHN GetFeatureInfo does not return exactly the cell you ask for, but the nearest cell that has a value, with its own coordinates (more than 2 metres away in our test). The terrain model dtm_05m is empty under buildings. For a roof shape you need the raster from WCS.
- The WCS GeoTIFF is compressed with deflate and Predictor 3 (floating point). A home-made reader that only inflates gives nonsense values. Empty cells are 3.4028235e38: filter them out before computing heights or slopes, or the ridge ends up 10^38 metres high.
- The surface model (DSM) is the highest point: trees overhanging the roof count as roof and produce odd slopes. PDOK serves AHN4 (captured 2020 to 2022), so a dormer or extension built later is missing. The script does not calculate shade from trees or neighbours.
- KNMI gives Q in J/cm² per day, not in kWh: divide by 360. Not every station measures radiation (31 of 48 with a full year in 2025); stations without Q return empty values, not an error. Use an average over several years: in De Bilt the annual sum between 2016 and 2025 ranged from 1,020 to 1,211 kWh/m², almost 20% apart.
- The yield is an estimate based on rules of thumb (orientation factors, 21% efficiency, performance ratio 0.8, 70% of the roof surface usable). Make them visible and adjustable in your tool. PVGIS from the JRC calculates much more precisely per pitch and orientation, but robots.txt of re.jrc.ec.europa.eu forbids all automated requests: refer users to the web tool and do not call the API from your code.
- The RVO potential map has figures and neighbourhood boundaries from 2014 and gives no units. The publication date on PDOK (2025) is not the reference date. Look up the neighbourhood with the point of the address, not with a current neighbourhood code.
Take it further
- Assess a whole street or neighbourhood: fetch all buildings in a bbox from the BAG WFS (bag:pand) and run the roof analysis per building. Colour a map by estimated kWh per building and look for roofs that are still empty.
- Yield per month: add up Q per month instead of per year. In De Bilt, averaged over 2016 to 2025, June brought 168 kWh/m² and December 15 kWh/m², more than eleven times less. That matters for anyone considering a home battery or heat pump.
- Estimate shade: fetch a larger piece of DSM (for example 60 by 60 metres) and check, for a few sun positions per season, whether surrounding trees and buildings rise above the sun's ray across the roof.
- Compare with reality: CBS publishes installed solar capacity per municipality. Put the estimated roof potential of a neighbourhood next to what has already been installed.
More with this data
Total installed solar capacity: 25.9 gigawatts in 2025, 288 times as much as in 2010
Total installed solar capacity, 2010 – 2025, in gigawatts. That is the highest point in the series.
Homes with solar panels: highest in Tynaarlo (65%), lowest in Amsterdam (9%)
Homes with solar panels per municipality, 2024, in percent of homes. Netherlands as a whole: 36. 342 municipalities with a figure.
The sources4

Addresses and Buildings Register (BAG)
Every address and building in the Netherlands with year of construction, floor area and use. The backbone for anything linked at address level.

Actueel Hoogtebestand Nederland (AHN, national elevation model)
The elevation map of the Netherlands, measured by laser from an aircraft: at least ten measurements per square metre. There are two maps. The terrain model (DTM) is the bare ground. The surface model (DSM) is everything on it, including buildings and trees. Via PDOK as a map layer (WMS), as a raster API (WCS) and as a download.

KNMI daily weather dataIn depth
Daily values from over fifty weather stations: temperature, rainfall, sunshine and wind. The De Bilt series starts in 1901.
Heat potential maps (WarmteAtlas)
Four map services from RVO's WarmteAtlas: the potential for underground heat and cold storage (WKO) per neighbourhood and municipality, biogas and woody biomass per municipality, a map of 2,283 business sites with their CO2 emissions for estimating residual heat, and a raster map of WKO potential in GJ per hectare per year. Mind the age: the neighbourhood and municipal figures are for 2014 (403 municipalities, the boundaries of that time) and the CO2 figures run to 2013. The dates on PDOK (2024 and 2025) are publication dates, not reference dates.
More to build
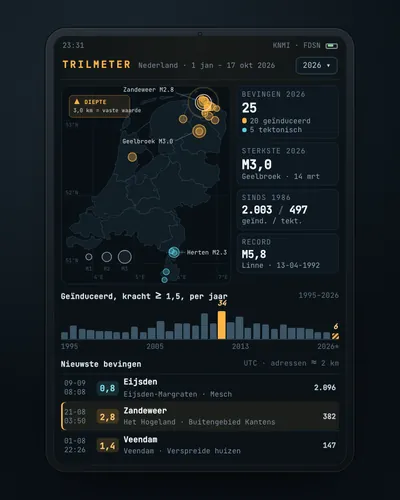 Earthquake tracker: every quake on the map, with municipality and homesMap
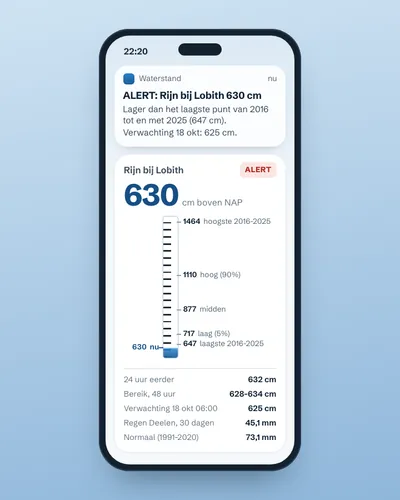 Alert when the river near you is too high or too lowAlert
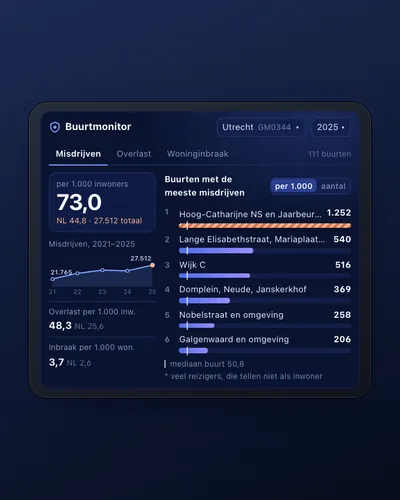 Neighbourhood safety monitor: nuisance and crime per neighbourhoodDashboard
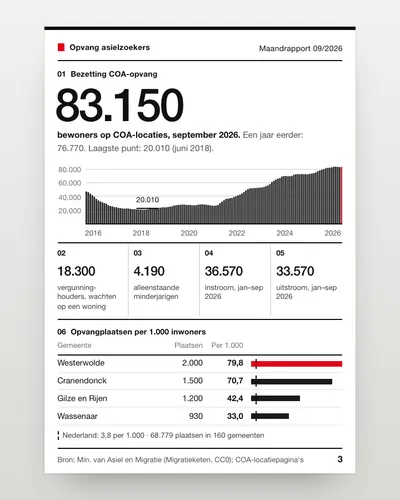 Asylum reception dashboard: national and per municipalityDashboard
 How fast is your municipality going electric?Analysis
 Climate risk check for an addressTool