Climate risk check for an address
Type a postcode and house number and get one report on how the building fares on heat, flooding from rain, flooding from rivers and sea, drought and foundation problems, using the Klimaateffectatlas maps, the AHN elevation model, the BAG and real groundwater measurements from the BRO.
geef_project("klimaatrisico-adres")geef_bron("klimaateffectatlas")geef_bron("pdok-bag")geef_bron("ahn")
I have the project, the tested calls and the pitfalls. I'll build a tool with Climate Impact Atlas (Klimaateffectatlas), Addresses and Buildings Register (BAG), Actueel Hoogtebestand Nederland (AHN, national elevation model) and Key Register of the Subsurface (BRO). This is how it could look:
You build this yourself. Copy the prompt into Claude, ChatGPT or Cursor, with the MCP server on, or follow the steps below.
Climate report
Note: model maps and one well, not a building inspection.
- Heatper areaFelt temperature; heat island +1.75 °CGevoelstemperatuurBuurt_202245.3 °Cextreme heat stress
- Flooding> 20 cm waterSmall chance; then 0.80 m of waterplaatsgebonden_overstromingskans_huidig_20_cm_202511201/300to 1/3,000 a year
- DroughtgroundwaterMeasured 12-03-2026; model says 3.04 mBRO GMW000000005707 · 32 m0.92 mbelow ground
- Foundationsper areaGround sinks 2.2 mm a yearnl_bodemdaling_totaal_v20260623lowpile rot 1.73 · settling 2.47
- Waterloggingaround buildingAfter a heavy downpour (99th percentile)nl_fcab_omgevingsscore_wateroverlast_v202608060 cmno nuisance
This is a mockup, not a working version, with the values from our test run on 16 October 2026 for Gouda town hall; the colour of each traffic light is our reading of the class in the map legend. Turn the MCP server on with the address on For AI.
Who it's for
House buyers and owners who want to know what to look out for, estate agents and valuers, municipalities and housing associations screening their stock, and journalists comparing a street or neighbourhood.
What you get
A tool that produces one report with five risks for an address. The address becomes a point via the BAG, the AHN gives the ground level, the Klimaateffectatlas gives the value at that point for each map together with the class from its own legend, and the BRO gives the real groundwater level in the nearest well.
Test run on 16 October 2026 with Gouda city hall (Markt 1, built 1459). The ground around the city hall is at -0.17 m NAP (median of 11 AHN points). Heat: the neighbourhood Nieuwe Markt e.o. has a mean physiological equivalent temperature of 45.3 °C on the heat map (extreme heat stress) and an urban heat island of 1.75 °C. Water around the building after heavy rain: 0 cm. Flooding: a small chance (1/300 to 1/3,000 per year) of more than 20 cm of water, and 0.80 m of water in such a flood. Foundations: pile rot low (score 1.73 per neighbourhood), differential settlement in 2050 low (2.47), the ground sinks 2.2 mm per year and by 4 cm between 2020 and 2050 in the high scenario. Groundwater: well GMW000000005707, 32 m away, was at -0.74 m NAP on 12 March 2026, 0.92 m below ground level at the well; in the year before it ranged from -1.02 to -0.26 m NAP (38,716 hourly readings since 2021).
For comparison the Rijksmuseum in Amsterdam (Museumstraat 1, built 1885): ground at +2.14 m NAP, physiological equivalent temperature in the Museumplein neighbourhood 47.0 °C, heat island 1.86 °C, 16 cm of water around the building after heavy rain (class medium), no flood probability class and no water depth on the flood map, pile rot and differential settlement very low, ground movement -1.0 mm per year.
The report also shows where model and measurement disagree: the national groundwater model says the lowest groundwater level in Gouda is 3.04 m below ground, but the well next to the city hall never measured deeper than 1.20 m below ground in the year up to 12 March 2026. For a building, the measurement is what counts.
Modelled feels-like temperature (PET) from the heat map: highest in Schiermonnikoog (47.7 °C), lowest in Zeist (38.8 °C)
Modelled feels-like temperature (PET) from the heat map per municipality, 2022, in degrees Celsius. Netherlands as a whole: 43.5. 342 municipalities with a figure.
How you could start7 steps
- 1
1. From address to point (BAG WFS)
Look up the address in the PDOK BAG WFS with an FES filter on postcode and house number. You get a point in RD coordinates (EPSG:28992, in metres), the construction year and the building ID. With srsName=EPSG:4326 you get the same point as longitude and latitude, needed for the BRO. Do not use the PDOK Locatieserver: robots.txt of api.pdok.nl excludes /bzk/locatieserver/*; service.pdok.nl allows everything. Pitfall: with zero hits numberMatched is missing from the response, so check the features list. And house letters (12A, 12B) give more than one object.
https://service.pdok.nl/lv/bag/wfs/v2_0?service=WFS&version=2.0.0&request=GetFeature&typeNames=bag:verblijfsobject&outputFormat=application/json&filter=<Filter xmlns%3D"http%3A%2F%2Fwww.opengis.net%2Ffes%2F2.0"><And><PropertyIsEqualTo><ValueReference>postcode<%2FValueReference><Literal>2801JG<%2FLiteral><%2FPropertyIsEqualTo><PropertyIsEqualTo><ValueReference>huisnummer<%2FValueReference><Literal>1<%2FLiteral><%2FPropertyIsEqualTo><%2FAnd><%2FFilter>
"numberMatched": 1, "crs": { "type": "name", "properties": { "name": "urn:ogc:def:crs:EPSG::28992" } }, "features": [ { "type": "Feature", "properties": { "identificatie": "0513010013060645", "oppervlakte": 1311, "status": "Verbouwing verblijfsobject", "gebruiksdoel": "kantoorfunctie,bijeenkomstfunctie,overige gebruiksfunctie", "openbare_ruimte": "Markt", "huisnummer": 1, "postcode": "2801JG", "woonplaats": "Gouda", "bouwjaar": 1459, "pandidentificatie": "0513100011122752", "pandstatus": "Pand in gebruik" }, "geometry": { "type": "Point", "coordinates": [ 108540.066, 447234.648 ] } } - 2
2. The ground level (AHN)
Use WMS GetFeatureInfo on the AHN layer dtm_05m to get the elevation relative to NAP. Use a 200 by 200 metre box with 200 pixels and click with i and j. Pitfall: the BAG point lies inside the building, and the terrain model has no value under buildings. In the middle of the city hall (i=j=100) the list is empty; 30 metres away (i=130) it says -0.24 m NAP. So take the median of a ring of points around it (the script uses 16 points at 30 and 60 metres). This is AHN4, collected from 2020 to 2022.
https://service.pdok.nl/rws/ahn/wms/v1_0?service=WMS&version=1.3.0&request=GetFeatureInfo&layers=dtm_05m&query_layers=dtm_05m&styles=&crs=EPSG:28992&bbox=108440,447135,108640,447335&width=200&height=200&i=130&j=100&info_format=application/json
{"type":"FeatureCollection","features":[{"type":"Feature","bbox":[108568.75,447237.25,108568.75,447237.25], "geometry":{"type":"Point","coordinates":[108568.75,447237.25]},"properties":{"value_list":"-0.2389999926"}}], ...} met i=100&j=100 (midden in het stadhuis): {"type":"FeatureCollection","features":[],"crs":{"properties":{"name":"urn:ogc:def:crs:EPSG::28992"},"type":"name"}} - 3
3. Pick the right map version (GetCapabilities)
The Klimaateffectatlas WMS (GeoServer at Sogelink, no key, 185 layers) has layer names with a version date, and old versions remain next to new ones. Fetch GetCapabilities (538 kB), find the names with the same start and take the highest date at the end (_20260128 over _20251219; a name without a date counts as the oldest). Put the chosen layer name in your report so readers know which map it was. The layers have no description in the service; the explanation is on klimaateffectatlas.nl.
https://cas.cloud.sogelink.com/public/data/org/gws/YWFMLMWERURF/kea_public/wms?service=WMS&request=GetCapabilities&version=1.3.0
<Name>maximale_waterdiepte_nederland_kleine_kans_20251219</Name>
<Name>maximale_waterdiepte_nederland_kleine_kans_20260128</Name>
<Name>plaatsgebonden_overstromingskans_huidig_200_cm_20251120</Name>
<Name>plaatsgebonden_overstromingskans_huidig_20_cm</Name>
<Name>plaatsgebonden_overstromingskans_huidig_20_cm_20251120</Name>
- 4
4. The value at your point and the class from the legend
GetFeatureInfo with info_format=application/json returns a number (GRAY_INDEX) for a raster layer and the fields of the polygon for a vector layer. What the number means is in GetLegendGraphic with format=application/json: with type values each number belongs to one class (3 = small chance), with type intervals a value gets the class of the first boundary above it. Vector layers have rules with a filter, such as no_cc_risi > '0.8' AND no_cc_risi <= '3' (low). Pitfall: nodata looks like a number. -9999 for water depth means dry or outside the area, 2147483647 for drought stress means no farmland, 55537 for the heat map means a building, and 0 for flood probability is not in the legend.
https://cas.cloud.sogelink.com/public/data/org/gws/YWFMLMWERURF/kea_public/wms?service=WMS&version=1.3.0&request=GetFeatureInfo&layers=plaatsgebonden_overstromingskans_huidig_20_cm_20251120&query_layers=plaatsgebonden_overstromingskans_huidig_20_cm_20251120&styles=&crs=EPSG:28992&bbox=108440,447135,108640,447335&width=200&height=200&i=100&j=100&info_format=application/json
{"type":"FeatureCollection","features":[{"type":"Feature","id":"","geometry":null,"properties":{"GRAY_INDEX":3}}],...} en de legenda (request=GetLegendGraphic&layer=…&format=application/json): "colormap": { "entries": [ { "label": "Extreem kleine kans: <1/30.000 per jaar ", "quantity": "1", "color": "#619900" }, { "label": "Zeer kleine kans: 1/3.000 tot 1/30.000 per jaar", "quantity": "2", "color": "#C5DB00" }, { "label": "Kleine kans: 1/300 tot 1/3.000 per jaar", "quantity": "3", "color": "#FFD900" }, { "label": "Middelgrote kans: 1/30 tot 1/300 per jaar", "quantity": "4", "color": "#FF8400" }, { "label": "Grote kans: > 1/30 per jaar", "quantity": "5", "color": "#FF2600" } ], "type": "values" } - 5
5. Heat per neighbourhood (WFS with a point)
The physiological equivalent temperature raster has no value on a building (55537). So use the neighbourhood layer GevoelstemperatuurBuurt_2022 via the WFS with cql_filter=INTERSECTS(geometry,POINT(x y)) in RD. _mean is the mean over the neighbourhood's raster cells, _count the number of cells. With propertyName without the geometry field GeoServer leaves out the geometry and the response stays small. Pitfall: the geometry is called geometry here and geom in other layers; a wrong name gives 'Illegal property name'. Which hot day the map models is not stated in the service.
https://cas.cloud.sogelink.com/public/data/org/gws/YWFMLMWERURF/kea_public/wfs?service=WFS&version=2.0.0&request=GetFeature&typeNames=kea_public:GevoelstemperatuurBuurt_2022&outputFormat=application/json&propertyName=buurtcode,buurtnaam,gemeentena,_count,_mean&cql_filter=INTERSECTS(geometry,POINT(108540.066 447234.648))
{"type":"FeatureCollection","features":[{"type":"Feature","id":"GevoelstemperatuurBuurt_2022.fid--397ef6d2_1a14674f9af_-2df8", "geometry":null,"properties":{"buurtcode":"BU05130100","buurtnaam":"Nieuwe Markt e.o.","gemeentena":"Gouda", "_count":15648,"_mean":45.26546523517382}}],"totalFeatures":1,"numberMatched":1,"numberReturned":1,...} - 6
6. Flooding from rain per building
The layer nl_fcab_omgevingsscore_wateroverlast_v20260806 has, per BAG building, the water depth around it after heavy rain (99th percentile, in metres) and a class from 'no troublesome water depth' to 'more than 30 cm'. GetFeatureInfo on the BAG point gives the building directly. Pitfall: filtering on identificatie_bag via the WFS hit a server error after 60 seconds (no index on that field); a point search takes just over a second. Another catch: at the Rijksmuseum the map found building 0363100012237298, while the BAG lists building 0363100012157857 for the address. Both buildings exist; the museum consists of several.
https://cas.cloud.sogelink.com/public/data/org/gws/YWFMLMWERURF/kea_public/wms?service=WMS&version=1.3.0&request=GetFeatureInfo&layers=nl_fcab_omgevingsscore_wateroverlast_v20260806&query_layers=nl_fcab_omgevingsscore_wateroverlast_v20260806&styles=&crs=EPSG:28992&bbox=120716,485801,120916,486001&width=200&height=200&i=100&j=100&info_format=application/json
{"type":"FeatureCollection","features":[{"type":"Feature","id":"nl_fcab_omgevingsscore_wateroverlast_v20260806.2385481", "geometry":{"type":"Polygon","coordinates":[[[120867.5,485903.2],[120866.2,485902], ...]]},"geometry_name":"geom", "properties":{"identificatie_bag":"0363100012237298","bouwjaar":1885,"ahn_invliegjaar":2023, "waterdiepte_p99":0.156000003218651,"waterdiepte_klasse":"15 tot 20 cm"}}],"totalFeatures":"unknown",...} - 7
7. Groundwater measured nearby (BRO)
Search for groundwater wells with a POST to characteristics/searches: a circle around your point (radius in kilometres, lat/lon in WGS84) and a registration period. The response is XML with each well's location and ground level (groundLevelPosition, m NAP). More than 2,000 wells is refused: within 1 km of Gouda city hall there were already 477. Then per well gmw-relations for its tubes and their groundwater level surveys (GLD), and seriesAsCsv for the series. Pitfalls: many wells have no series or an empty CSV (GLD000000094630 returned 0 lines), time is in epoch milliseconds, and there is one column per quality regime. publiek.broservices.nl returned a 503 for robots.txt, so there are no rules.
curl -X POST "https://publiek.broservices.nl/gm/gmw/v1/characteristics/searches" \
  -H 'Content-Type: application/json' -d '{"registrationPeriod":{"beginDate":"1900-01-01","endDate":"2026-10-16"},"area":{"enclosingCircle":{"center":{"lat":52.0119,"lon":4.7106},"radius":1}}}'
<numberOfDocuments>477</numberOfDocuments><dispatchDocument><GMW_C gml:id="BRO_0002"> <brocom:broId>GMW000000005701</brocom:broId><brocom:deregistered>nee</brocom:deregistered> <brocom:qualityRegime>IMBRO/A</brocom:qualityRegime> <brocom:standardizedLocation srsName="urn:ogc:def:crs:EPSG::4258"><gml:pos>52.013343320 4.711304490</gml:pos> ...<groundLevelPosition uom="m">0.030</groundLevelPosition>... <screenPositionRange><shallowestScreenTopPosition uom="m">-1.130</shallowestScreenTopPosition>... en daarna https://publiek.broservices.nl/gm/gld/v1/seriesAsCsv/GLD000000013616: Tijdstip,Voorlopige Waarde [m],Voorlopige Opmerking,Beoordeelde Waarde [m],Beoordeelde Opmerking,Controle Waarde [m],... 1615161616000,-0.789,,,,,,, ... 1773302390000,-0.736,,,,,,,
How the sources fit together
- Addresses and Buildings Register (BAG)Climate Impact Atlas (Klimaateffectatlas)via
RD-coördinaten (EPSG:28992) en de BAG-pandidentificatieThe BAG point in RD goes straight into the GetFeatureInfo bbox and the WFS INTERSECTS filter. The rain flooding map is per BAG building, so its identificatie_bag field can be compared with the building ID from the BAG.
- Addresses and Buildings Register (BAG)Actueel Hoogtebestand Nederland (AHN, national elevation model)via
RD-coördinatenThe BAG point falls inside the building, where the AHN terrain model is empty. A ring of points around it gives the street level.
- Actueel Hoogtebestand Nederland (AHN, national elevation model)Key Register of the Subsurface (BRO)via
hoogte in m NAPThe BRO gives the groundwater level in m NAP. Subtract it from the ground level (from the well itself or from the AHN) and you have the depth below ground. In Gouda the well gave +0.18 m NAP as ground level and the AHN -0.17 around the city hall: use the one that belongs to where the measurement was taken.
- Key Register of the Subsurface (BRO)Climate Impact Atlas (Klimaateffectatlas)via
grondwaterstand onder maaiveldThe drought maps (GLG_Huidig, LG_extreemdroogjaar_Huidig) are a national model. Compare them with the well measurement: in Gouda the model said 3.04 m, the well never measured deeper than 1.2 m below ground in a year.
Let AI build it
Paste this prompt into Claude, ChatGPT, Cursor or Lovable. It names the real endpoints, the join keys and the pitfalls, so the assistant writes working code straight away. Always check the result against the source itself.
Build a web tool 'Climate risk check': the user types a postcode and house number and gets one report with five risks (heat, rain flooding, river and sea flooding, drought, foundations), each with the value, the class from the map's legend, the map layer name and a short explanation. Plus a small map with the point and a table with the groundwater measurement from the nearest well. All sources are open and need no key. Use your own User-Agent (for example 'my-project/1.0 (+you@example.com)') in every call, and make the calls on the server (Klimaateffectatlas and BRO were not tested as CORS sources).

Step 1, address to point: the PDOK BAG WFS, https://service.pdok.nl/lv/bag/wfs/v2_0 with service=WFS, version=2.0.0, request=GetFeature, typeNames=bag:verblijfsobject, outputFormat=application/json and an FES 2.0 filter (namespace http://www.opengis.net/fes/2.0) with PropertyIsEqualTo on postcode (no space, '2801JG') and huisnummer. Default in RD (EPSG:28992); with srsName=EPSG:4326 as [lon, lat]. With zero hits numberMatched is missing. House letters return more objects: let the user choose. Do NOT use the PDOK Locatieserver: robots.txt of api.pdok.nl disallows /bzk/locatieserver/*.

Step 2, ground level: AHN via https://service.pdok.nl/rws/ahn/wms/v1_0, request=GetFeatureInfo, layers=query_layers=dtm_05m, crs=EPSG:28992, a 200 x 200 m bbox around the point, width=height=200, i/j = pixel, info_format=application/json; the elevation is in properties.value_list (text, m NAP). There is no value under buildings (empty features), so take the median of 16 points at 30 and 60 m around the address. WMS 1.3.0 with EPSG:28992: bbox is x,y (east, north).

Step 3, Klimaateffectatlas: WMS https://cas.cloud.sogelink.com/public/data/org/gws/YWFMLMWERURF/kea_public/wms and WFS at .../kea_public/wfs (GeoServer). Layer names carry a version date (_20260128, _v20260806) and old versions stay: read GetCapabilities and pick the highest date per map. Use these maps:
- Heat: WFS kea_public:GevoelstemperatuurBuurt_2022 with cql_filter=INTERSECTS(geometry,POINT(x y)) and propertyName=buurtnaam,_mean (mean physiological equivalent temperature per neighbourhood in °C; classes from the legend of raster layer gevoelstemperatuur_2022). Plus raster layer hitteeiland (°C warmer than the countryside). The raster gevoelstemperatuur_2022 itself returns 55537 on buildings: do not use it at the address point.
- Rain flooding: nl_fcab_omgevingsscore_wateroverlast_v... (vector, per BAG building: waterdiepte_p99 in m and waterdiepte_klasse). Query via GetFeatureInfo or WFS INTERSECTS; a WFS filter on identificatie_bag hangs (60 s, server error).
- River and sea flooding: plaatsgebonden_overstromingskans_huidig_20_cm_... (class 1 to 5, type values; 0 is not in the legend: show 'no probability class') and maximale_waterdiepte_nederland_kleine_kans_... (m; -9999 = dry or outside the area).
- Drought: GLG_Huidig and LG_extreemdroogjaar_Huidig (m below ground, national model). droogtestress_huidig returns 2147483647 outside farmland: call it 'not applicable'.
- Foundations: risicopaalrot_huidig (field no_cc_risi) and risicoverschilzetting_2050laag (field mild_cc_ri), per neighbourhood; nl_bodemdaling_totaal_v... (field snelheid, mm per year, negative = sinking) and bodemdaling_2020_2050hoog (m).
GetFeatureInfo: version=1.3.0, crs=EPSG:28992, bbox 200 x 200 m, width=height=200, i=j=100, info_format=application/json. Raster: properties.GRAY_INDEX. Vector: the polygon's fields (geometry included). Get the meaning from GetLegendGraphic&layer=<layer>&format=application/json: raster colormap type 'values' = exact value, 'intervals' = class of the first quantity greater than or equal; vector rules with a filter text such as "no_cc_risi > '3' AND no_cc_risi <= '6'". The unit of the pile rot and settlement scores is not in the service: show the score with its class, do not invent a unit.

Step 4, BRO groundwater: POST JSON to https://publiek.broservices.nl/gm/gmw/v1/characteristics/searches with {"registrationPeriod":{"beginDate":"1900-01-01","endDate":"<today>"},"area":{"enclosingCircle":{"center":{"lat":..,"lon":..},"radius":1}}} (radius in km). The response is XML: per GMW_C a broId, gml:pos (lat lon, EPSG:4258) and groundLevelPosition (m NAP). More than 2,000 wells is refused: make the radius smaller. Sort by distance, call https://publiek.broservices.nl/gm/v1/gmw-relations/<GMW id> per well (JSON with monitoringTubeReferences[].gldReferences[].broId) and then https://publiek.broservices.nl/gm/gld/v1/seriesAsCsv/<GLD id>. CSV columns: Tijdstip (epoch ms), Voorlopige Waarde [m], Beoordeelde Waarde [m], Controle Waarde [m], Onbekend Waarde [m], each with a remarks column. Take the first filled value per line. Many series are empty or old: take the nearest well with a reading in the last two years and show the date, the latest level, the minimum and maximum of the year before and the depth below the well's ground level.

Report: per risk a card with the class in colour (the colours are in the legend JSON), the value with unit, the layer name and one sentence of explanation. At the top: these are model maps and scenarios, per neighbourhood or per raster cell, not a forecast for this house. At the bottom the attribution 'Klimaateffectatlas, 2026' (CC BY 4.0), BAG and AHN (PDOK), BRO (TNO, CC0). Show when model and measurement disagree (groundwater).
Try it yourself
The core of the project in a small script. Needs: Python 3.10+ en requests. Tested on 2026-10-16; below is the real output of that run.
# Klimaatrisico-check voor een adres: hitte, wateroverlast, overstroming, droogte en fundering.
# Bronnen: BAG (PDOK WFS), AHN (PDOK WMS), Klimaateffectatlas (WMS/WFS), BRO (grondwaterputten). Geen sleutels.
import math, re, sys, statistics, requests
from datetime import datetime, timezone, timedelta

UA = {"User-Agent": "mijn-project/1.0 (+jij@voorbeeld.nl)"}
KEA = "https://cas.cloud.sogelink.com/public/data/org/gws/YWFMLMWERURF/kea_public"
POSTCODE, HUISNUMMER = (sys.argv[1], sys.argv[2]) if len(sys.argv) > 2 else ("2801JG", "1")

def get(url, **params):
    r = requests.get(url, params=params, headers=UA, timeout=90)
    r.raise_for_status()
    return r

# 1. Adres naar punt: BAG-WFS, één keer in RD (EPSG:28992) en één keer in WGS84 (lon, lat).
def bag(srs):
    f = ('<Filter xmlns="http://www.opengis.net/fes/2.0"><And>'
         f'<PropertyIsEqualTo><ValueReference>postcode</ValueReference><Literal>{POSTCODE}</Literal></PropertyIsEqualTo>'
         f'<PropertyIsEqualTo><ValueReference>huisnummer</ValueReference><Literal>{HUISNUMMER}</Literal></PropertyIsEqualTo>'
         '</And></Filter>')
    j = get("https://service.pdok.nl/lv/bag/wfs/v2_0", service="WFS", version="2.0.0", request="GetFeature",
            typeNames="bag:verblijfsobject", outputFormat="application/json", srsName=srs, filter=f).json()
    if not j["features"]:   # bij nul treffers ontbreekt numberMatched: kijk naar de lijst zelf
        sys.exit(f"Geen adres gevonden voor {POSTCODE} {HUISNUMMER}")
    return j["features"][0]   # met huisletter of toevoeging kunnen het er meer zijn

vbo = bag("EPSG:28992")
X, Y = vbo["geometry"]["coordinates"]
LON, LAT = bag("EPSG:4326")["geometry"]["coordinates"]
p = vbo["properties"]
print(f"{p['openbare_ruimte']} {p['huisnummer']}, {p['woonplaats']}: bouwjaar {p['bouwjaar']}, {p['gebruiksdoel']}")
print(f"  RD {X:.0f}, {Y:.0f}  WGS84 {LAT:.5f}, {LON:.5f}\n")

# 2. Waarde op het punt: WMS GetFeatureInfo met een vak van 200 x 200 m en de klik in het midden.
def punt(wms, laag, x=X, y=Y, i=100, j=100):
    f = get(wms, service="WMS", version="1.3.0", request="GetFeatureInfo", layers=laag, query_layers=laag, styles="",
            crs="EPSG:28992", bbox=f"{x-100},{y-100},{x+100},{y+100}", width=200, height=200, i=i, j=j,
            info_format="application/json").json()["features"]
    return f[0]["properties"] if f else None

# Maaiveld uit het AHN (DTM): onder een gebouw is er geen waarde, dus mediaan van een ring van 16 punten rondom.
ring = []
for straal in (30, 60):
    for k in range(8):
        a = k * math.pi / 4
        v = punt("https://service.pdok.nl/rws/ahn/wms/v1_0", "dtm_05m", i=100 + round(straal * math.cos(a)), j=100 - round(straal * math.sin(a)))
        if v:
            ring.append(float(v["value_list"]))
MAAIVELD = statistics.median(ring)
print(f"Maaiveld (AHN4, mediaan van {len(ring)} van 16 punten op 30 en 60 m): {MAAIVELD:+.2f} m NAP\n")

# 3. Klimaateffectatlas: kies per kaart de nieuwste versie uit GetCapabilities (laagnamen eindigen op een datum).
cap = get(f"{KEA}/wms", service="WMS", request="GetCapabilities", version="1.3.0").text
namen = set(re.findall(r"<Name>([^<]+)</Name>", cap))
def nieuwste(begin):
    kandidaten = [n for n in namen if n == begin or re.fullmatch(re.escape(begin) + r"_v?\d{8}", n)]
    return max(kandidaten, key=lambda n: re.search(r"(\d{8})$", n).group(1) if re.search(r"\d{8}$", n) else "0")

def klasse(laag, waarde, veld=None):
    """Zoek de klasse in de legenda (GetLegendGraphic als JSON)."""
    leg = get(f"{KEA}/wms", service="WMS", version="1.3.0", request="GetLegendGraphic", layer=laag, format="application/json").json()
    for rule in leg["Legend"][0]["rules"]:
        ras = rule["symbolizers"][0].get("Raster")
        if ras:   # rasterlaag: 'intervals' = eerste grens erboven, 'values' = precies gelijk
            cm = ras["colormap"]
            for e in cm["entries"]:
                q = float(e["quantity"])
                if (cm["type"] == "values" and waarde == q) or (cm["type"] != "values" and waarde <= q):
                    return e.get("label", "").strip()
            return "buiten de legenda"
        f = rule.get("filter", "")   # vectorlaag: filters als "no_cc_risi > '3' AND no_cc_risi <= '6'"
        voorwaarden = re.findall(r"(\w+) (>=|<=|>|<|=) '([^']*)'", f)
        def ok(v, op, d):
            if op == "=":
                return str(v) == d
            v, d = float(v), float(d)
            return {">=": v >= d, "<=": v <= d, ">": v > d, "<": v < d}[op]
        if voorwaarden and all(ok(waarde, op, d) for _, op, d in voorwaarden):
            return rule.get("title") or rule.get("name")
    return "?"

def kea(laag, veld="GRAY_INDEX"):
    v = punt(f"{KEA}/wms", laag)
    return None if v is None else v.get(veld)

print("HITTE")
buurt = get(f"{KEA}/wfs", service="WFS", version="2.0.0", request="GetFeature", typeNames="kea_public:GevoelstemperatuurBuurt_2022",
            outputFormat="application/json", propertyName="buurtnaam,gemeentena,_mean",
            cql_filter=f"INTERSECTS(geometry,POINT({X} {Y}))").json()["features"][0]["properties"]
print(f"  Gevoelstemperatuur (PET), gemiddeld over buurt {buurt['buurtnaam']}: {buurt['_mean']:.1f} °C ({klasse('gevoelstemperatuur_2022', buurt['_mean'])})")
hi = kea("hitteeiland")
print(f"  Stedelijk hitte-eiland: {hi:.2f} °C warmer dan het platteland ({klasse('hitteeiland', hi)})")

print("WATEROVERLAST")
l = nieuwste("nl_fcab_omgevingsscore_wateroverlast")
w = punt(f"{KEA}/wms", l)
if w:
    print(f"  Water rond pand {w['identificatie_bag']} na een hevige bui (99e percentiel): {w['waterdiepte_p99']*100:.0f} cm ({klasse(l, w['waterdiepte_klasse'])}) [{l}]")
else:
    print("  Geen pand van de wateroverlastkaart op dit punt")

print("OVERSTROMING")
l = nieuwste("plaatsgebonden_overstromingskans_huidig_20_cm")
k = kea(l)
print(f"  Kans op meer dan 20 cm water: {klasse(l, k) if k else 'waarde 0, geen kansklasse in de legenda'} [{l}]")
l = nieuwste("maximale_waterdiepte_nederland_kleine_kans")
d = kea(l)
print(f"  Waterdiepte bij een overstroming met kleine kans: {'droog of buiten het gebied' if d is None or d < 0 else f'{d:.2f} m'} [{l}]")

print("DROOGTE")
for l, wat in [("GLG_Huidig", "Grondwater in een gemiddeld droge periode (GLG)"), ("LG_extreemdroogjaar_Huidig", "Grondwater in een extreem droog jaar")]:
    v = kea(l)
    print(f"  {wat}: {v:.2f} m onder maaiveld ({klasse(l, v)})")

print("FUNDERING EN BODEMDALING")
for l, veld, wat in [("risicopaalrot_huidig", "no_cc_risi", "Risico op paalrot, huidig klimaat"),
                     ("risicoverschilzetting_2050laag", "mild_cc_ri", "Risico op verschilzetting, 2050 laag scenario")]:
    v = kea(l, veld)
    print(f"  {wat}: {v:.2f} ({klasse(l, v)}), per buurt")
l = nieuwste("nl_bodemdaling_totaal")
v = kea(l, "snelheid")
print(f"  Gemeten bodembeweging: {v:.1f} mm per jaar ({klasse(l, v)}) [{l}]")
v = kea("bodemdaling_2020_2050hoog")
print(f"  Verwachte daling 2020 tot 2050, hoog scenario: {v*100:.0f} cm ({klasse('bodemdaling_2020_2050hoog', v)})")

# 4. BRO: dichtstbijzijnde grondwaterput met een recente meetreeks.
print("GRONDWATER GEMETEN (BRO)")
xml = requests.post("https://publiek.broservices.nl/gm/gmw/v1/characteristics/searches", headers=UA, timeout=90, json={
    "registrationPeriod": {"beginDate": "1900-01-01", "endDate": datetime.now().strftime("%Y-%m-%d")},
    "area": {"enclosingCircle": {"center": {"lat": LAT, "lon": LON}, "radius": 1}}}).text   # straal in km; max 2.000 putten
putten = []
for doc in re.findall(r"<GMW_C.*?</GMW_C>", xml, re.S):
    la, lo = map(float, re.search(r"<gml:pos>([\d.]+) ([\d.]+)</gml:pos>", doc).groups())   # EPSG:4258: lat, lon
    mv = re.search(r'<groundLevelPosition uom="m">([-\d.]+)', doc)
    km = 6371 * math.hypot(math.radians(lo - LON) * math.cos(math.radians(LAT)), math.radians(la - LAT))
    putten.append((km, re.search(r"<brocom:broId>([^<]+)", doc).group(1), float(mv.group(1)) if mv else None))
print(f"  {len(putten)} putten binnen 1 km")
grens = datetime.now(timezone.utc) - timedelta(days=365)
for km, put, mv in sorted(putten)[:25]:
    rel = get(f"https://publiek.broservices.nl/gm/v1/gmw-relations/{put}").json()
    for buis in rel["monitoringTubeReferences"]:
        for gld in buis["gldReferences"]:
            csv = get(f"https://publiek.broservices.nl/gm/gld/v1/seriesAsCsv/{gld['broId']}").text.splitlines()[1:]
            reeks = []
            for regel in csv:
                c = regel.split(",")
                waarde = next((c[k] for k in (3, 1, 5, 7) if c[k]), None)   # beoordeeld, voorlopig, controle, onbekend
                if waarde:
                    reeks.append((datetime.fromtimestamp(int(c[0]) / 1000, timezone.utc), float(waarde)))
            recent = [w for t, w in reeks if t >= reeks[-1][0] - timedelta(days=365)] if reeks else []
            if reeks and reeks[-1][0] >= grens - timedelta(days=365):
                t, laatst = reeks[-1]
                print(f"  Put {put} ({km*1000:.0f} m), buis {buis['tubeNumber']}, reeks {gld['broId']}: {len(reeks)} metingen, {reeks[0][0]:%Y} tot {t:%d-%m-%Y}")
                print(f"  Laatste stand {laatst:+.2f} m NAP; laagste in het jaar ervoor {min(recent):+.2f}, hoogste {max(recent):+.2f} m NAP")
                if mv is not None:
                    print(f"  Dat is {mv - laatst:.2f} m onder het maaiveld bij de put ({mv:+.2f} m NAP volgens de BRO)")
                raise SystemExit
print("  Geen put met een meetreeks van de afgelopen twee jaar gevonden")
Markt 1, Gouda: bouwjaar 1459, kantoorfunctie,bijeenkomstfunctie,overige gebruiksfunctie
  RD 108540, 447235  WGS84 52.01153, 4.71047

Maaiveld (AHN4, mediaan van 11 van 16 punten op 30 en 60 m): -0.17 m NAP

HITTE
  Gevoelstemperatuur (PET), gemiddeld over buurt Nieuwe Markt e.o.: 45.3 °C (Extreme Hittestress (niveau 1): 44°C – 45°C)
  Stedelijk hitte-eiland: 1.75 °C warmer dan het platteland (1.6-1.8 °C)
WATEROVERLAST
  Water rond pand 0513100011122752 na een hevige bui (99e percentiel): 0 cm (Geen hinderlijke waterdiepte) [nl_fcab_omgevingsscore_wateroverlast_v20260806]
OVERSTROMING
  Kans op meer dan 20 cm water: Kleine kans: 1/300 tot 1/3.000 per jaar [plaatsgebonden_overstromingskans_huidig_20_cm_20251120]
  Waterdiepte bij een overstroming met kleine kans: 0.80 m [maximale_waterdiepte_nederland_kleine_kans_20260128]
DROOGTE
  Grondwater in een gemiddeld droge periode (GLG): 3.04 m onder maaiveld (> 2,0m)
  Grondwater in een extreem droog jaar: 3.14 m onder maaiveld (> 2,0m)
FUNDERING EN BODEMDALING
  Risico op paalrot, huidig klimaat: 1.73 (Laag), per buurt
  Risico op verschilzetting, 2050 laag scenario: 2.47 (Laag), per buurt
  Gemeten bodembeweging: -2.2 mm per jaar (Beperkt (1.5 tot 5 mm/jaar daling)) [nl_bodemdaling_totaal_v20260623]
  Verwachte daling 2020 tot 2050, hoog scenario: 4 cm (Beperkt (3-10cm))
GRONDWATER GEMETEN (BRO)
  482 putten binnen 1 km
  Put GMW000000005707 (32 m), buis 1, reeks GLD000000013616: 38716 metingen, 2021 tot 12-03-2026
  Laatste stand -0.74 m NAP; laagste in het jaar ervoor -1.02, hoogste -0.26 m NAP
  Dat is 0.92 m onder het maaiveld bij de put (+0.18 m NAP volgens de BRO)
Where it goes wrong
- Model maps, not a forecast for this house. The Klimaateffectatlas models scenarios on a grid or per neighbourhood. Pile rot and settlement are scores per neighbourhood; a centuries-old city hall in a 'low' neighbourhood can still stand on wooden piles. Say so at the top of your report.
- Nodata disguised as a number: -9999 (water depth: dry or outside the area), 2147483647 (drought stress: no farmland), 55537 (heat map: building), 0 for flood probability (not in the legend). Treat anything outside the legend as 'no value', not as a risk.
- Layer names change with every update (_20251219 became _20260128) and old versions stay online. Do not hard-code a layer name: pick the newest per map from GetCapabilities and show which one it was.
- The address point lies inside the building. The AHN terrain is empty there and the heat raster has no value. Look around the building (a ring of points) or use the neighbourhood layer.
- Model and measurement disagree. The national groundwater model gave a lowest level of 3.04 m below ground in Gouda; the well 32 m away measured at most 1.2 m between March 2025 and March 2026. Show both and say which is which.
- BRO wells without a series or with an old one are the rule, not the exception. The nearest well to the city hall (GMW000000092160, 24 m) had an empty CSV; in Amsterdam the nearest usable series (25 readings) ended in April 2025. Keep looking until a well with recent readings and show the date.
- Attribute filters on large Klimaateffectatlas vector layers (such as identificatie_bag on the rain flooding map) hit a server error after 60 seconds. Always search spatially (GetFeatureInfo or INTERSECTS with a point).
Take it further
- Scenarios side by side: the same maps often exist for now, 2050 and 2085 or 2100 (risicopaalrot_2050hoog, GLG_2085Hoog, plaatsgebonden_overstromingskans_norm_plus_klimaatverandering_2100_...). Show per risk how it shifts.
- A whole street or neighbourhood: fetch all address objects of a postcode from the BAG and map the rain flooding class per building. Mind the pace: one call per building, be frugal.
- The groundwater series next to rainfall: put the BRO series next to the daily rainfall of the nearest KNMI station (knmi-daggegevens) and show how fast the groundwater recovers after a dry summer.
- What lies beneath: search for cone penetration tests (CPT) in the BRO around the address (/sr/cpt/v1/characteristics/searches) and show how deep the soft layers go. That says more about foundation risk than a neighbourhood score.
More with this data
Groundwater monitoring wells in the BRO by year built: 2,786 wells in 2025, 2.2 times as much as in 1990
Groundwater monitoring wells in the BRO by year built, 1990 – 2025, in wells. The highest point was 2022 (3,698).
The sources4

Climate Impact Atlas (Klimaateffectatlas)
National maps of what climate change does to the Netherlands: perceived temperature, drought, groundwater, subsidence, water depth in a flood and in extreme rain. Often for today and for 2050, 2085 or 2100. There is also a neighbourhood dashboard with figures per neighbourhood. Available as map layers (WMS), vector data (WFS) and download.

Addresses and Buildings Register (BAG)
Every address and building in the Netherlands with year of construction, floor area and use. The backbone for anything linked at address level.

Actueel Hoogtebestand Nederland (AHN, national elevation model)
The elevation map of the Netherlands, measured by laser from an aircraft: at least ten measurements per square metre. There are two maps. The terrain model (DTM) is the bare ground. The surface model (DSM) is everything on it, including buildings and trees. Via PDOK as a map layer (WMS), as a raster API (WCS) and as a download.

Key Register of the Subsurface (BRO)
The national register of what lies underground and what is measured there: cone penetration tests, geological, soil and geotechnical boreholes, groundwater monitoring wells with their time series (some from the 1950s), groundwater composition, abstractions and mining permits. Government bodies must have their surveys registered here; TNO runs the national facility on behalf of the Ministry of the Interior (BZK). Fourteen REST services on publiek.broservices.nl, each with an OpenAPI description, plus a copy on PDOK. On 16 October 2026 it held 97,768 groundwater monitoring wells.
More to build
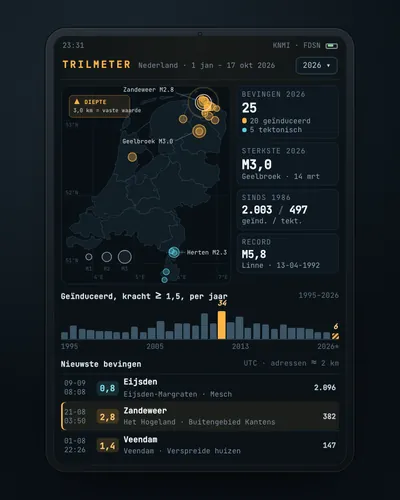 Earthquake tracker: every quake on the map, with municipality and homesMap
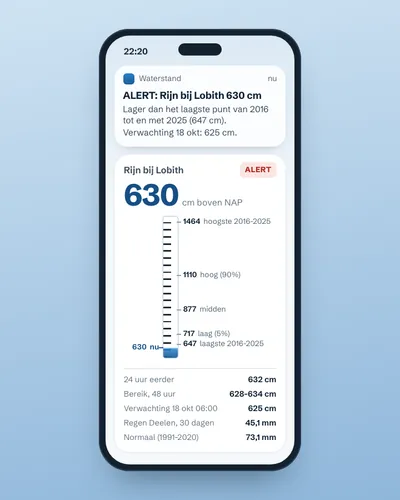 Alert when the river near you is too high or too lowAlert
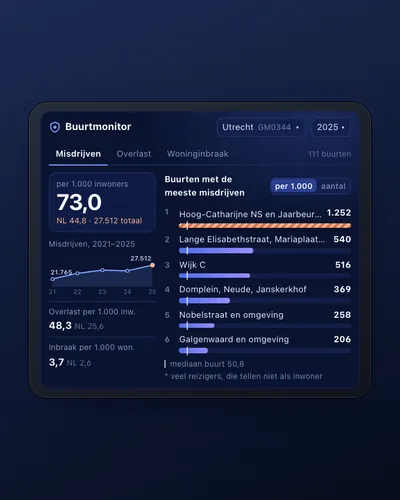 Neighbourhood safety monitor: nuisance and crime per neighbourhoodDashboard
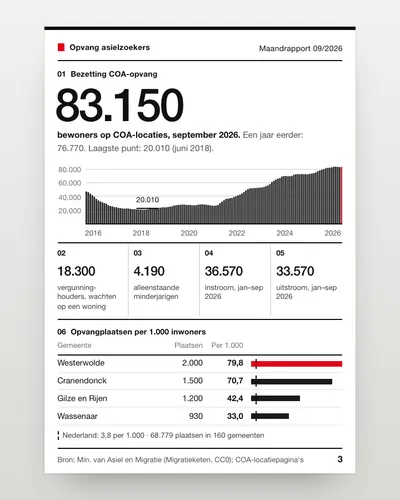 Asylum reception dashboard: national and per municipalityDashboard
 Air quality alert for your own streetAlert
 Nature in your neighbourhood: which species were seen and how green is it?App