Wildfire risk (fire service)
The fire service states per safety region how high the risk of a wildfire is: phase 1 (normal, everyone is prepared) or phase 2 (it has been dry for a long time, a fire can develop quickly and unpredictably). brandweer.nl only shows today's state, with no history and no documented API. We read the page every day and store the result, so a series builds up from 16 October 2026.
Wildfire risk today: 24× phase 1, 1× unknown
Each municipality in the colour of its safety region's phase. Read from brandweer.nl on 31 October at 10:41; the regions come from Statistics Netherlands (2025).
- Amsterdam-AmstellandPhase 1
- Brabant-NoordPhase 1
- Brabant-ZuidoostPhase 1
- DrenthePhase 1
- FlevolandPhase 1
- FryslânPhase 1
- Gelderland-MiddenPhase 1
- Gelderland-ZuidPhase 1
- Gooi- en VechtstreekPhase 1
- GroningenPhase 1
- HaaglandenPhase 1
- Hollands MiddenPhase 1
- IJssellandPhase 1
- KennemerlandPhase 1
- Limburg-NoordPhase 1
- Midden- en West-BrabantPhase 1
- Noord- en Oost-GelderlandPhase 1
- Noord-Holland-NoordPhase 1
- Rotterdam-RijnmondPhase 1
- TwentePhase 1
- UtrechtPhase 1
- Zaanstreek-WaterlandUnknown
- ZeelandPhase 1
- Zuid-Holland-ZuidPhase 1
- Zuid-LimburgPhase 1
More examples from this source2
The largest wildfires in the Netherlands according to EFFIS: most Deurne, April 2020 (649 hectares), then Elburg, April 2026 and Ede, April 2014
The largest wildfires in the Netherlands according to EFFIS, 2003–2026, in hectares. Total: 3,049; the largest 12 of 53 categories are shown. Deurne, April 2020 is 21% of the total. All 53 areas EFFIS has mapped in the Netherlands since 2003, 3,049 hectares together. Municipality as EFFIS names it. Small fires are missing.
Burnt natural land in the Netherlands mapped by EFFIS: 330 hectares in 2025, 80% more than in 2018
Burnt natural land in the Netherlands mapped by EFFIS, 2018 – 2025, in hectares. The highest point was 2020 (822).
What you can build with it1
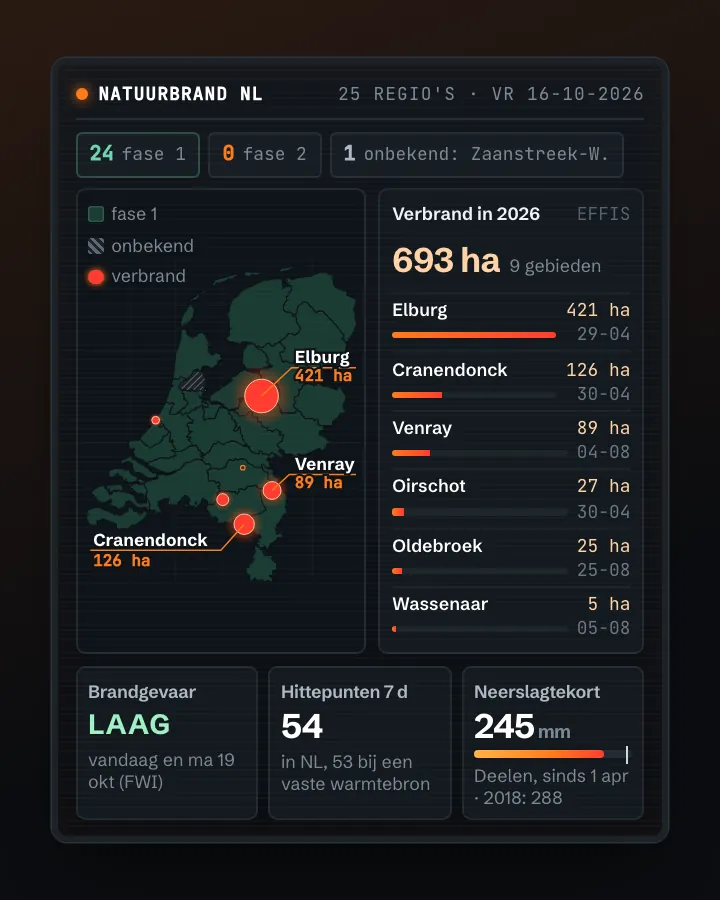
What can you do with it?2 ideas
A drought warning on your map
Colour the safety regions by today's phase, for a dashboard on drought or recreation.
Did the warning work?
Store the phase every day and compare it with the fires EFFIS and NASA FIRMS saw: did large fires come after phase 2?
How to process it3 steps
Read the list on the page
Under 'Alle locaties & huidige fase' each region has a block with its name and phase ('Fase 1', 'Fase 2' or 'Onbekend'). robots.txt of brandweer.nl allows reading.
https://www.brandweer.nl/natuurbrandrisico/
Or the colours as JSON
The map on the site fetches a colour per region code (VR01 – VR25). That address is not documented and returns colours, not phase numbers; you have to derive the translation from the page yourself.
https://www.brandweer.nl/wp-json/brandweer/v1/regio-phase-colors
Store it yourself
There is no archive. Read the page once a day and save the date with the phase per region.
Interesting combinations

Fire danger versus fires
EFFIS gives the burnt areas with date and municipality; compare them with the phase of the safety region.

How dry was it?
Count the days without rain before a new phase: the phase follows drought.
Similar sources
- EFFIS wildfires (Copernicus)
A calculated fire danger (Fire Weather Index) as a map layer for all of Europe, not the fire service's phase.
What to watch out for
- No API, no history
Only today's state, on a web page. What we store starts on 16 October 2026.
- Unknown is not a phase
On 16 October 2026 Zaanstreek-Waterland was 'Onbekend' (unknown). Do not count that as phase 1.
- Regions, not municipalities
The phase applies to a whole safety region. For municipalities you need the assignment of municipalities to safety regions (CBS, Gebieden in Nederland).
APIHTML-pagina + WordPress REST (ongedocumenteerd, JSON) · read 16 Oct 2026
No key. No official API: the page and the WordPress endpoint are public (tested). tested
safety regions with a phase (16 Oct 2026: 24 × Phase 1, 1 × Unknown) tested
htmljson
Base URL
https://www.brandweer.nl/wp-json/brandweer/v1
Endpoints 2
- GET
/regio-phase-colorsColour per safety region (VR01 … VR25), as on the map. No phase number: on 16 Oct 2026 #dd9933 meant Phase 1, #B0C4DE Unknown (VR11). - GET
https://www.brandweer.nl/natuurbrandrisico/HTML with per region <div class="risk">name<div class="risk-phase">Fase 1</div>; this is the source for the phase number.
Filtering tested
No filters: you always get all 25 regions with the current state.
What you get back 3
| Name | Type | Meaning |
|---|---|---|
VR01 … VR25 | tekst (#rrggbb) | Kleur van de fase per veiligheidsregio (JSON-eindpunt) |
div.risk (tekst) | tekst | Naam van de veiligheidsregio (HTML) |
div.risk-phase | tekst | Fase 1, Fase 2 … of Onbekend (HTML) |
Limits and pitfalls
- robots.txt of brandweer.nl asks Crawl-delay: 10 (seconds between requests). The state changes at most a few times a day: fetching once a day is enough. tested
- Current state only, no history and no last-changed date on the page. Want a series? Store the state every day yourself (Open Data Index does so in its status check). tested
- The JSON endpoint is undocumented and may change without notice; it returns colours, not phases. Use the HTML for the phase number. tested
- Region names differ from CBS (86059NED): 'Gooi- en Vechtstreek' vs 'Gooi en Vechtstreek', 'Hollands Midden' vs 'Hollands-Midden', 'Zuid-Limburg' vs 'Limburg-Zuid'. Join on the VR code or compare letters only. experience
- The HTML page is ~150 kB; parse on the classes risk and risk-phase, not by position in the page. tested
Try it HTTP 200 · 1,195 ms · 16 Oct
https://www.brandweer.nl/wp-json/brandweer/v1/regio-phase-colors
{
  "VR05": "#dd9933",
  "VR08": "#dd9933",
  "VR24": "#dd9933",
  "VR19": "#dd9933",
  "VR12": "#dd9933",
  "VR13": "#dd9933",
  "VR11": "#B0C4DE",
  "VR10": "#dd9933",
  "VR23": "#dd9933",
  "VR18": "#dd9933",
  "VR17": "#dd9933",
  "VR01": "#dd9933",
  "VR03": "#dd9933",
  "VR04": "#dd9933"
}
Shortened response, saved at harvest time. Click the URL for the real, current response.
Read from WordPress route description of the brandweer/v1 namespace: one route, regio-phase-colors (GET) · The page with the phase per safety region and the explanation of the phases. Labels: from the description stated in what the api itself publishes. tested from our own small call. platform applies to every api on this platform, per its documentation. experience learned while building open data index.
How to fetch it
curl -A "mijn-onderzoek/1.0 (+jij@voorbeeld.nl)" "https://www.brandweer.nl/wp-json/brandweer/v1/regio-phase-colors"
More in this topic



See how this page is built
bron: natuurbrandrisico
blokken: []
secties:
  - ideeen
  - verwerken
  - koppelingen
  - vergelijkbaar
  - beperkingen
  - code
cache:
  tag: bron:natuurbrandrisico
  ververs: na statuscheck, als de bron nieuwer is
statuscheck:
  methode: fase per veiligheidsregio van brandweer.nl, dagelijks gelezen en bewaard
  verwacht: dagelijks
Source: content/bronnen/natuurbrandrisico.yaml · Markdown