
Heat potential maps (WarmteAtlas)
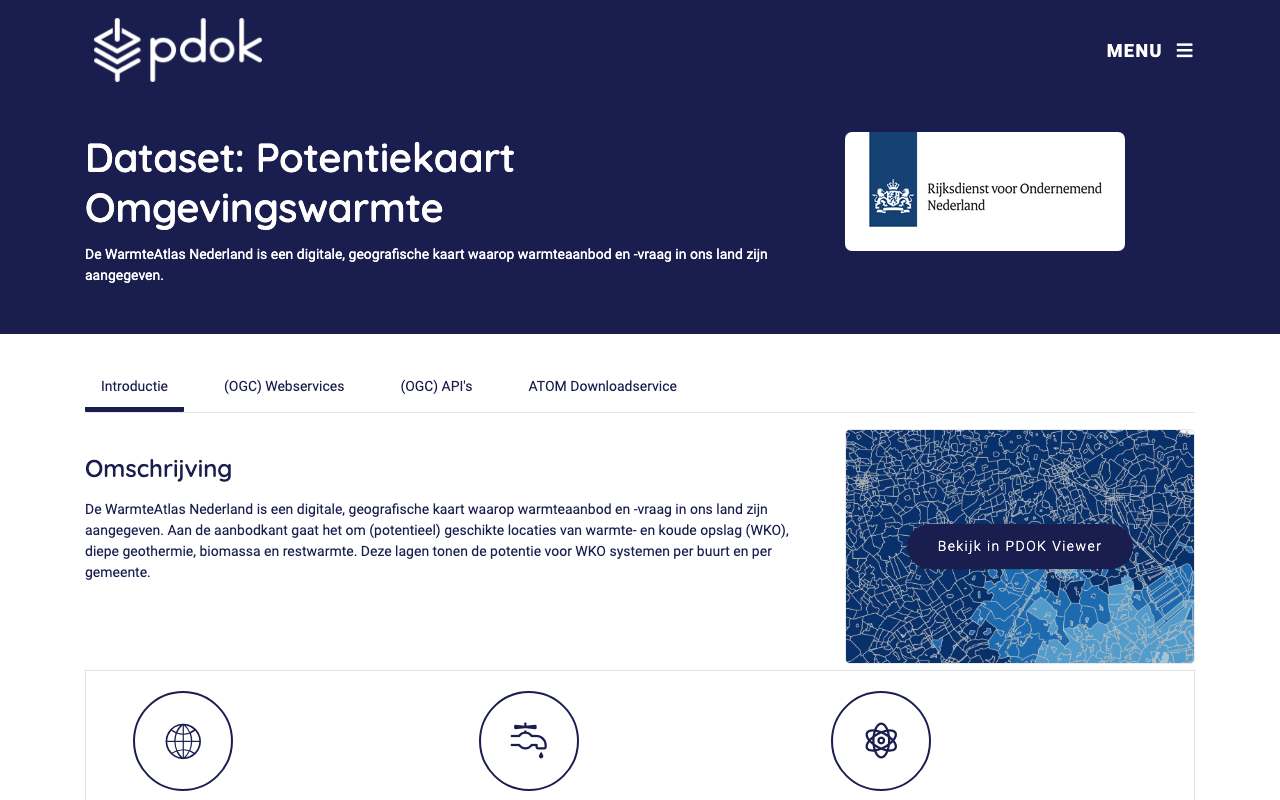
Four map services from RVO's WarmteAtlas: the potential for underground heat and cold storage (WKO) per neighbourhood and municipality, biogas and woody biomass per municipality, a map of 2,283 business sites with their CO2 emissions for estimating residual heat, and a raster map of WKO potential in GJ per hectare per year. Mind the age: the neighbourhood and municipal figures are for 2014 (403 municipalities, the boundaries of that time) and the CO2 figures run to 2013. The dates on PDOK (2024 and 2025) are publication dates, not reference dates.
Sites on the residual heat map by sector: most sewerage and wastewater treatment (832 sites), then other industry and chemical industry
Sites on the residual heat map by sector, November 2024, in sites. Total: 2,283; the largest 10 of 10 categories are shown. Sewerage and wastewater treatment is 36% of the total. The date is the publication on PDOK. The map is older: each site has CO2 emissions from 1990 to 2013; later years are missing.
What you can build with it1
What can you do with it?4 ideas
Where could a neighbourhood switch to ground heat?
Each neighbourhood has the potential for open and closed WKO systems in GJ per hectare per year, next to household heat use. Compare the two. Use the figures as a first sketch: they are from 2014.
Where is the residual heat?
The residual heat map has 2,283 business sites with sector, SBI code and CO2 emissions in 1990, 1995, 2000, 2005, 2010, 2012 and 2013. Most are wastewater treatment plants (832); the biggest emitter in 2013 is E.On on the Maasvlakte (7.2 megatonnes), followed by Essent Amer and Tata Steel IJmuiden.
Biogas from manure and organic waste per municipality
Residual flows gives the biogas potential per municipality from liquid manure, arable residues and organic waste, in GJ per hectare of land. Highest: Renswoude, Boekel and Sint Anthonis (2014 municipalities).
Then and now
Compare the 2013 CO2 emissions on the residual heat map with current figures from the Emissieregistratie. Which large emitters have closed since?
How to process it4 steps
Get neighbourhood figures
Each neighbourhood collection has the same fields: residents, dwellings, heat use and all potentials. At most 1,000 per page, the next link gives the following; 12,005 neighbourhoods.
https://api.pdok.nl/rvo/potentiekaart-omgevingswarmte/ogc/v1/collections/warmteopenwkobuurt/items?f=json&limit=1000
All residual heat sites
Two pages of 1,000 and a third of 283. The fields kgco2_1990 to kgco2_2013 are in kilograms; 0 sometimes means unknown (Shell Moerdijk has 0 in 2000).
https://api.pdok.nl/rvo/potentiekaart-restwarmte/ogc/v1/collections/liggingindustrieco2/items?f=json&limit=1000
Join to the 2014 CBS neighbourhoods
cbs_buurtcode_1 is the 2014 neighbourhood code (BU…) or municipal code (GM…). Join to the 2014 district and neighbourhood map, not the current one: many municipalities have merged since.
https://api.pdok.nl/rvo/potentiekaart-reststromen/ogc/v1/collections/totaalpotentieelbiogas/items?f=json&limit=1000
Counting with the WFS
Each API also has a WFS. resultType=hits returns the number of objects.
https://service.pdok.nl/rvo/potentiekaart-omgevingswarmte/wfs/v1_0?service=WFS&version=2.0.0&request=GetFeature&resultType=hits&typeNames=warmteopenwkobuurt
Interesting combinations


Potential versus current gas use
Join the WKO potential per neighbourhood to the average gas use from the CBS key figures. Use the 2014 CBS table for the same neighbourhood codes.
Which 2013 emitters still exist?
Look up the largest sites of the residual heat map in the Emissieregistratie and compare 2013 emissions with today.
Similar sources
- Netherlands Pollutant Release and Transfer Register (Emissieregistratie)
Current emissions per sector and year; the residual heat map stops in 2013 but gives the location per company.
- WN
 Climate Impact Atlas (Klimaateffectatlas)
Maps of heat, drought and flooding; no energy potential.
What to watch out for
- Old figures with a new date
The collections show updated 2024-11-21 (residual heat), 2025-06-26 (ambient heat), 2025-07-03 (residual flows) and 2025-10-16 (WKO potential). The content is older: field jaar is 2014 and the CO2 fields run to 2013. According to the NGR the WKO map was last revised on 25 May 2018.
- Municipalities of 2014
The municipal collections have 403 municipalities, including Bedum, Maasdonk and Littenseradiel, which no longer exist. Do not join to the current municipal map.
- No field descriptions
The collections' /schema gives only field names and types, no units or explanation. tj_warmte on the residual heat map is presumably heat in terajoules, but it is not stated.
- Truncated names
Some text fields are truncated, such as the sector 'Riolering en waterzuiveringsinstallat'.
APIOGC WFS 2.0.0 · read 16 Oct 2026
No key. Fees: none; access constraints: https://creativecommons.org/publicdomain/zero/1.0/deed.nl. from the description
features in restwarmte:liggingindustrieco2 tested
application/gml+xml; version=3.2text/xml; subtype=gml/3.2.1text/xml; subtype=gml/3.1.1application/json; subtype=geojsonapplication/json
Base URL
https://service.pdok.nl/rvo/potentiekaart-restwarmte/wfs/v1_0
Endpoints 5
- GET
?request=GetCapabilitiesservice description - GET
?request=DescribeFeatureTypefields of a layer (XSD) - GET
?request=GetFeaturethe features themselves, with geometry - GET
?request=ListStoredQueriesstored queries - GET
?request=DescribeStoredQueriesstored query details
Layers and projections
- Ligging industrie en CO2
restwarmte:liggingindustrieco2EPSG:28992, EPSG:25831, EPSG:25832, EPSG:3034, EPSG:3035, EPSG:3857, EPSG:4258, EPSG:4326
Filtering from the description
OGC Filter Encoding (FES 2.0)
Parameters 6
typeNames | which layer: restwarmte:liggingindustrieco2 | from the description |
outputFormat | e.g. application/json for GeoJSON | from the description |
srsName | projection, e.g. EPSG:4326 for web maps (default EPSG:28992, RD) | from the description |
count / startIndex | paging | from the description |
filter | FES XML filter on fields or geometry | from the description |
bbox | box in the chosen projection | platform |
Fields 18 · restwarmte:liggingindustrieco2
| Name | Type | Meaning |
|---|---|---|
geom | geometrie | |
gid | integer | |
nic | integer | |
bedrijf | string | |
sbiCode | double | |
sbi | string | |
doelgroep | string | |
subdoelgr | string | |
kgco21990 | double | |
kgco21995 | double | |
kgco22000 | double | |
kgco22005 | double |
Show all 18
| Name | Type | Meaning |
|---|---|---|
kgco22010 | double | |
kgco22012 | double | |
kgco22013 | double | |
tjWarmte | double | |
weergave | double | |
fuuid | string |
Limits and pitfalls
- At most 1,000 features per request (CountDefault). from the description
- Paging supported: count and startIndex (ImplementsResultPaging). from the description
- In the WFS fields are named differently from the OGC API: tjWarmte and kgco22013 versus tj_warmte and kgco2_2013. tested
- The four OGC APIs: potentiekaart-omgevingswarmte (8 collections), potentiekaart-reststromen (7), potentiekaart-restwarmte (1) and potentieel-warmte-koude-opslagsystemen (3), all under https://api.pdok.nl/rvo/. tested
Try it HTTP 200 · 291 ms · 16 Oct
https://service.pdok.nl/rvo/potentiekaart-restwarmte/wfs/v1_0?request=GetFeature&service=WFS&version=2.0.0&typeNames=restwarmte:liggingindustrieco2&outputFormat=application/json&srsName=EPSG:4326&count=1&propertyName=bedrijf,doelgroep,tjWarmte,kgco22013
{
  "type": "FeatureCollection",
  "name": "liggingindustrieco2",
  "crs": {
    "type": "name",
    "properties": {
      "name": "urn:ogc:def:crs:OGC:1.3:CRS84"
    }
  },
  "features": [
    {
      "type": "Feature",
      "properties": {
        "bedrijf": "Shell Nederland Chemie BV (Moerdijk)",
        "doelgroep": "Chemische Industrie",
        "kgco22013": 2372540000,
        "tjWarmte": 32218
      },
      "bbox": [
        4.562109291255243,
        51.68785345709976
      ],
      "geometry": {
        "type": "Point",
        "coordinates": "…"
      }
    }
  ],
  "bbox": [
    4.56210929125524,
    51.6878534570998
  ]
}
Shortened response, saved at harvest time. Click the URL for the real, current response.
Read from GetCapabilities: layers, projections, formats, filters, limit · DescribeFeatureType: fields of restwarmte:liggingindustrieco2. Labels: from the description stated in what the api itself publishes. tested from our own small call. platform applies to every api on this platform, per its documentation. experience learned while building open data index.
How to fetch it
curl "https://api.pdok.nl/rvo/potentiekaart-restwarmte/ogc/v1/collections/liggingindustrieco2/items?f=json&limit=5"
More from RVO in our index
84 datasets in data.overheid.nl, Nationaal Georegister. These changed most recently.
- EP-Online webservice (geregistreerde energielabels)2026-10-28
- Visserijmaatregelen Noordzee (INSPIRE geharmoniseerd)2026-08-19
- Potentieel koude en warmte uit open en gesloten WKO systemen (GJ/ha.jaar)2026-08-19
- Potentieel koude uit gesloten WKO systemen per gemeente (GJ/ha.jaar)2026-08-19
- Potentieel warmte uit gesloten WKO systemen per buurt (GJ/ha.jaar)2026-08-19
- Potentieel koude uit gesloten WKO systemen per buurt (GJ/ha.jaar)2026-08-19
More in this topic



See how this page is built
bron: rvo-potentiekaarten
blokken: []
secties:
  - ideeen
  - verwerken
  - koppelingen
  - vergelijkbaar
  - beperkingen
  - code
cache:
  tag: bron:rvo-potentiekaarten
  ververs: na statuscheck, als de bron nieuwer is
statuscheck:
  methode: nieuwste veld updated van de collecties in de vier OGC API's
    (publicatiedatum, niet de peildatum van de cijfers)
  verwacht: elke paar jaar
Source: content/bronnen/rvo-potentiekaarten.yaml · Markdown