Nature in your neighbourhood: which species were seen and how green is it?
An app that shows, for any point in the Netherlands, which plants and animals were observed within 1 km, how much of the land is green and how far away the nearest Natura 2000 site is.


 With GBIF biodiversity, ESA WorldCover and Natura 2000 sites
geef_project("biodiversiteit-buurt")geef_bron("gbif")geef_bron("esa-worldcover")geef_bron("natura2000")
I have the project, the tested calls and the pitfalls. I'll build a app with GBIF biodiversity, ESA WorldCover and Natura 2000 sites. This is how it could look:
You build this yourself. Copy the prompt into Claude, ChatGPT or Cursor, with the MCP server on, or follow the steps below.
2021–2025
- built-up65.7%
- trees28.5%
- grass2.7%
- water2.6%
Seen most often all 486 →
This is a mockup, not a working version, with the figures from our test run on 16 October 2026 for the Vondelpark (GBIF 2021–2025, ESA WorldCover 2021, Natura 2000 from PDOK). Turn the MCP server on with the address on For AI.
Who it's for
Residents and neighbourhood councils who want to know what lives around their home, schools (a local study with real data), green volunteers, municipalities that want to compare greenery and biodiversity per district, and makers of a 'nature around the corner' widget.
What you get
A script (and then a small map with a search box) that counts the GBIF observations for a point, shows species and groups with Dutch names, looks up the waarneming.nl grid cell, lists Natura 2000 sites within 10 km and computes the land cover within 1 km.
Test run on 16 October 2026 for the Vondelpark in Amsterdam (52.358 N, 4.8686 E): within 1 km, from 2021 to 2025, 21,279 observations of 486 species. 95% were birds (20,138), mostly from eBird (83%). Most seen: coot (1,168), rose-ringed parakeet (1,161), Egyptian goose (1,068) and moorhen (1,061). Waarneming.nl is in GBIF only on 0.05-degree cells: the cell around the Vondelpark holds 64,595 observations of 2,444 species. Land cover within 1 km (ESA WorldCover 2021): 65.7% built-up, 28.5% trees, 2.7% grass, 2.6% water, 31% green in total. The nearest Natura 2000 site is Markermeer & IJmeer at 7.6 km.
For comparison a point in Ede on the edge of the Veluwe (52.040 N, 5.690 E, Burgemeestersbuurt): only 399 observations of 236 species within 1 km, but 85% green (75.0% trees) and the Veluwe at 0.3 km. Fewer observations here does not mean less nature, but fewer people reporting what they see.
Records from the Netherlands in GBIF by class: most bird (Aves) (5,567,722 records), then insect (Insecta) and dicots (Magnoliopsida)
Records from the Netherlands in GBIF by class, 2025, in records. Total: 12,496,874; the largest 12 of 123 categories are shown. Bird (Aves) is 45% of the total. Grouped by class; the total also counts records without a class. One record is one observation of a species, sometimes of several individuals at once.
How you could start7 steps
- 1
Count the observations around your point
The GBIF search API (api.gbif.org/v1, no key, robots.txt allows it) has a parameter geoDistance=latitude,longitude,distance. With limit=0 you get no records but you do get the count, and with facet= the breakdown by species (speciesKey), group (classKey) or dataset. Set facetLimit high enough to count all species (5,000 is plenty for 1 km). Filter on a period (year=2021,2025) and on occurrenceStatus=PRESENT, otherwise 'not found' records from surveys are counted too. Groups are keys: 212 is birds (Aves), 220 dicots (Magnoliopsida), 216 insects.
https://api.gbif.org/v1/occurrence/search?geoDistance=52.358,4.8686,1km&limit=0&facet=classKey&facetLimit=10&occurrenceStatus=PRESENT&year=2021,2025
{"offset":0,"limit":0,"endOfRecords":false,"count":21279,"results":[],"facets":[{"field":"CLASS_KEY","counts":[ {"name":"212","count":20138},{"name":"220","count":735},{"name":"216","count":208},{"name":"196","count":99}, {"name":"186","count":37},{"name":"367","count":8},{"name":"179","count":6},{"name":"180","count":6},...]}]} - 2
See which datasets it comes from
With facet=datasetKey you see who supplied the observations. Around the Vondelpark 83% came from eBird (birders), 11% from iNaturalist and 2% from Birda; 14 datasets in total. That explains why birds dominate. Licences differ per dataset: eBird is CC BY 4.0, iNaturalist, Birda and Observation.org are CC BY-NC 4.0 (non-commercial). If you pass on or publish records, credit the datasets, or make a download with a DOI via gbif.org.
https://api.gbif.org/v1/dataset/50c9509d-22c7-4a22-a47d-8c48425ef4a7
facet=datasetKey: [('4fa7b334', 17736), ('50c9509d', 2446), ('6ff8b3b0', 498), ('14d5676a', 343), ('7a3679ef', 106), ...] 14 datasets EOD – eBird Observation Dataset | http://creativecommons.org/licenses/by/4.0/legalcode iNaturalist Research-grade Observations | http://creativecommons.org/licenses/by-nc/4.0/legalcode Birda - Global Observation Dataset | http://creativecommons.org/licenses/by-nc/4.0/legalcode Pl@ntNet automatically identified occurrences | http://creativecommons.org/licenses/by/4.0/legalcode - 3
Give species a Dutch name
A facet only returns keys. /species/<key> gives the scientific name, /species/<key>/vernacularNames all common names with a language code; take the first with language nld. That list is paginated (the coot has more than 200), so ask for limit=500. For large groups such as Magnoliopsida, Liliopsida and Agaricomycetes there is no Dutch name: show the scientific one, or add your own translation table. Cache the names, they rarely change.
https://api.gbif.org/v1/species/2479226/vernacularNames?limit=200
2474377 Fulica atra Eurasian Coot Aves endOfRecords False, 200 namen [('Meerkoet', 'EUNIS Biodiversity Database'), ...] 2479226 Psittacula krameri Rose-ringed Parakeet Aves True, 152 [('Halsbandparkiet', 'EUNIS Biodiversity Database'), ('Halsbandparkiet', 'Catalogue of Life'), ...] 2498252 Alopochen aegyptiaca Egyptian Goose Aves True, 106 [('Nijlgans', 'Catalogue of Life'), ...] 5228199 Gallinula chloropus Eurasian Moorhen Aves True, 197 [('Waterhoen', 'EUNIS Biodiversity Database'), ...] - 4
Find waarneming.nl on its own grid
Waarneming.nl (Observation.org) is the largest Dutch source in GBIF: 107,932,072 records in the Netherlands. But the coordinates are rounded with floor(coord * 20) / 20, onto cells of 0.05 degree (about 5.6 km north-south and 3.4 km east-west), with coordinateUncertaintyInMeters 5000. That is why not a single waarneming.nl record came back within 1 km of the Vondelpark. Find the cell your point falls in with decimalLatitude and decimalLongitude exactly on the rounded values (52.35 and 4.85 for the Vondelpark): 64,595 observations of 2,444 species in 2021 to 2025. A polygon around the cell does not work: the corner points of neighbouring cells are counted too (258,334).
https://api.gbif.org/v1/occurrence/search?datasetKey=8a863029-f435-446a-821e-275f4f641165&decimalLatitude=52.35&decimalLongitude=4.85&year=2021,2025&occurrenceStatus=PRESENT&limit=1
{"count": 64595} {"species": "Anas platyrhynchos", "vernacularName": "Domestic Duck", "decimalLatitude": 52.35, "decimalLongitude": 4.85, "coordinateUncertaintyInMeters": 5000.0, "dataGeneralizations": "WGS84 coordinates generalized with formula: `coord = floor(coord * 20) / 20`", "eventDate": "2025-01-02", "license": "http://creativecommons.org/licenses/by-nc/4.0/legalcode"} - 5
Natura 2000 nearby
The PDOK WFS for Natura 2000 (CC0) filters on a bbox; with srsName=EPSG:4326 and the bbox in latitude,longitude order plus urn:ogc:def:crs:EPSG::4326. This MapServer WFS always returns the full outline, even if you ask for few fields: a 20 by 20 km box around Ede was 7.0 MB, because the whole Veluwe and the whole Rijntakken come along. So keep the bbox small. One site can consist of several features (Birds Directive, Habitats Directive or both, beschermin VR, HR or VR+HR): merge on nr. Compute distance and 'inside or not' yourself from the outline.
https://service.pdok.nl/rvo/natura2000/wfs/v1_0?service=WFS&version=2.0.0&request=GetFeature&typeNames=natura2000:natura2000&outputFormat=application/json&srsName=EPSG:4326&bbox=51.950,5.544,52.130,5.836,urn:ogc:def:crs:EPSG::4326
HTTP 200, 7.024.945 bytes, 2,3 s, 4 features {"naamN2K": "Binnenveld", "vhnNew": 2, "nr": 65, "beschermin": "HR", "sitecodeH": "NL2003006", "status": "Natura 2000-besluit 30 april 2014", ...} MultiPolygon {"naamN2K": "Veluwe", "vhnNew": 3, "nr": 57, "beschermin": "VR+HR", "sitecodeV": "NL3009017", "sitecodeH": "NL9801023", ...} MultiPolygon {"naamN2K": "Rijntakken", "vhnNew": 1, "nr": 38, "beschermin": "VR", ...} MultiPolygon {"naamN2K": "Rijntakken", "vhnNew": 3, "nr": 38, "beschermin": "VR+HR", ...} MultiPolygon - 6
Find the WorldCover tile
ESA WorldCover (10 m, CC BY 4.0) can be used via Microsoft Planetary Computer without an account. The VITO map service only returned errors in October 2026. Use STAC to find which tile contains your point: you get two, 2020 (v100) and 2021 (v200). Take 2021; there will be no newer editions. The classes with their names are in the map asset under classification:classes, so you do not have to type them in.
curl -X POST "https://planetarycomputer.microsoft.com/api/stac/v1/search" \
  -H 'Content-Type: application/json' -d '{"collections":["esa-worldcover"],"intersects":{"type":"Point","coordinates":[4.8686,52.358]},"limit":5}'
2 items: ESA_WorldCover_10m_2021_v200_N51E003 (2.0.0, 2021-01-01T00:00:00Z) en ESA_WorldCover_10m_2020_v100_N51E003 (1.0.0) "classification:classes": [{"value": 10, "color-hint": "006400", "description": "Tree cover"}, {"value": 20, ... "Shrubland"}, {"value": 30, ... "Grassland"}, {"value": 40, ... "Cropland"}, {"value": 50, ... "Built-up"}, {"value": 60, ... "Bare / sparse vegetation"}, {"value": 70, ... "Snow and ice"}, {"value": 80, ... "Permanent water bodies"}, {"value": 90, ... "Herbaceous wetland"}, {"value": 95, ... "Mangroves"}, {"value": 100, ... "Moss and lichen"}] - 7
Compute the land cover within 1 km
POST a GeoJSON Feature (a 64-point circle) to the statistics endpoint with categorical=true: you get a histogram with the number of pixels per class. Add max_size=1024; for a 1 km circle it also worked without, but for larger polygons the service returned a 502 without max_size. Work with percentages: pixels are in degrees, not square metres (60,242 valid pixels for 3.1 km²). WorldCover is the 2021 state and a model: the Vondelpark area shows 0.4% 'cropland'.
curl -X POST "https://planetarycomputer.microsoft.com/api/data/v1/item/statistics?collection=esa-worldcover&item=ESA_WorldCover_10m_2021_v200_N51E003&assets=map&categorical=true&max_size=1024" \
  -H 'Content-Type: application/json' -d '{"type":"Feature","properties":{},"geometry":{"type":"Polygon","coordinates":[[[4.8686,52.366983],[4.870042,52.36694],"... 64 punten op 1 km rond het Vondelpark ...",[4.8686,52.366983]]]}}'
{"type":"Feature","geometry":{...},"properties":{"statistics":{"map_b1":{"min":10.0,"max":90.0,"mean":38.79170678264334, "count":60242.0, ... "majority":50.0,"minority":90.0,"unique":6.0,"valid_percent":78.78,"masked_pixels":16222.0, "valid_pixels":60242.0, ... "histogram":[[17185.0,1656.0,233.0,39592.0,1540.0,36.0],[10.0,30.0,40.0,50.0,80.0,90.0]]}}}}
How the sources fit together
- GBIF biodiversityESA WorldCovervia
punt en straal (dezelfde cirkel van 1 km)Put the number of species next to the share of green. Be careful with conclusions: the number of observations mostly depends on how many people are looking. The Vondelpark (31% green) had 486 species in GBIF, the point in Ede (85% green) 236.
- GBIF biodiversityNatura 2000 sitesvia
afstand van het punt tot de omtrekAlso look up the GBIF observations inside the Natura 2000 site itself (geometry= with a simplified outline, counter-clockwise) and show which species you can see a little further away.
- ESA WorldCoverDistrict and neighbourhood mapvia
buurtgrens als vlakInstead of a circle, use the CBS/PDOK neighbourhood boundary as the polygon for the statistics endpoint. Then you can compare green per neighbourhood with the neighbourhood statistics (residents, homes).
Let AI build it
Paste this prompt into Claude, ChatGPT, Cursor or Lovable. It names the real endpoints, the join keys and the pitfalls, so the assistant writes working code straight away. Always check the result against the source itself.
Build a 'Nature in your neighbourhood' web app. The user clicks on a map (or searches an address) and sees, within 1 km: how many observations and species there are, the breakdown by group, the most seen species with Dutch names, how much of the land is green, and the nearest Natura 2000 site. No keys needed. Send an honest User-Agent with every call.

1. Observations (GBIF): GET https://api.gbif.org/v1/occurrence/search?geoDistance=LAT,LON,1km&year=2021,2025&occurrenceStatus=PRESENT&limit=0&facet=speciesKey&facet=classKey&facet=datasetKey&facetLimit=5000. The response has count and facets[].counts[] with {name: key, count}. Number of species = length of the speciesKey list.
2. Names: GET https://api.gbif.org/v1/species/KEY (canonicalName) and https://api.gbif.org/v1/species/KEY/vernacularNames?limit=500, first with language 'nld'. Large groups such as Magnoliopsida have no Dutch name: show the scientific one or use your own table. Cache all names.
3. Waarneming.nl: dataset 8a863029-f435-446a-821e-275f4f641165 has coordinates rounded with floor(coord*20)/20 (0.05-degree cells, 5 km uncertainty). You usually will not find them within 1 km. Request the cell separately with decimalLatitude=floor(LAT*20)/20 and decimalLongitude=floor(LON*20)/20 (exact values, no polygon) and show it as 'in the wider area (cell of about 5.6 by 3.4 km)'.
4. Natura 2000: GET https://service.pdok.nl/rvo/natura2000/wfs/v1_0?service=WFS&version=2.0.0&request=GetFeature&typeNames=natura2000:natura2000&outputFormat=application/json&srsName=EPSG:4326&bbox=LAT1,LON1,LAT2,LON2,urn:ogc:def:crs:EPSG::4326 (note: latitude first). The outline always comes along (megabytes for the Veluwe): keep the bbox at 10 km at most and cache the response. Merge features on nr; beschermin is VR, HR or VR+HR. Compute distance and point-in-polygon yourself (or with turf.js).
5. Green: POST https://planetarycomputer.microsoft.com/api/stac/v1/search with {"collections":["esa-worldcover"],"intersects":{"type":"Point","coordinates":[LON,LAT]}}; take the item with the highest esa_worldcover:product_version (2021, v200). Classes are in assets.map['classification:classes']. Then POST https://planetarycomputer.microsoft.com/api/data/v1/item/statistics?collection=esa-worldcover&item=ITEM_ID&assets=map&categorical=true&max_size=1024 with a GeoJSON Feature (64-point circle, [lon, lat]). properties.statistics.map_b1.histogram = [[counts],[class values]]. Green = 10 trees, 20 shrubs, 30 grass, 90 wetland, 100 moss. Work in percentages.

Pitfalls the app must explain: more observations mainly means more observers (city parks and birders), not more nature; birds dominate (95% around the Vondelpark) because eBird is the biggest source; licences differ per dataset (iNaturalist and waarneming.nl CC BY-NC); WorldCover is the 2021 state and a model with errors (cropland in a city park); the Natura 2000 distance is an approximation.

Output: a map with the circle, a donut with land cover, a bar per group, a list of the 10 most seen species (Dutch name, scientific name, count, link to gbif.org/species/KEY), the line 'Natura 2000: Veluwe at 0.3 km', and at the bottom the sources with licence.
Try it yourself
The core of the project in a small script. Needs: Python 3.10+ en requests. Tested on 2026-10-16; below is the real output of that run.
# Biodiversiteit in je buurt: welke soorten zijn er gezien (GBIF), hoe groen is het (ESA WorldCover) en ligt er
# Natura 2000 in de buurt (PDOK)? Geen sleutels nodig. Vereist: Python 3.10+ en requests.
import math, sys
import requests

LAT, LON, STRAAL = 52.358, 4.8686, 1.0          # Vondelpark, Amsterdam; straal in km
if len(sys.argv) == 3:
    LAT, LON = float(sys.argv[1]), float(sys.argv[2])
JAREN = "2021,2025"
UA = {"User-Agent": "mijn-project/1.0 (+jij@voorbeeld.nl)"}
GBIF = "https://api.gbif.org/v1"
get = lambda url, **p: requests.get(url, params=p, headers=UA, timeout=120).json()

def naam(key):   # Nederlandse naam als die er is, anders de wetenschappelijke
    s = get(f"{GBIF}/species/{key}")
    nl = [v["vernacularName"] for v in get(f"{GBIF}/species/{key}/vernacularNames", limit=500)["results"] if v.get("language") == "nld"]
    return (nl[0].lower() if nl else s.get("canonicalName", key)), s.get("canonicalName", "")

# 1. Waarnemingen binnen de straal, alle datasets (geoDistance = breedte,lengte,afstand).
basis = {"geoDistance": f"{LAT},{LON},{STRAAL}km", "year": JAREN, "occurrenceStatus": "PRESENT", "limit": 0}
r = get(f"{GBIF}/occurrence/search", **basis, facet=["speciesKey", "classKey", "datasetKey"], facetLimit=5000)
f = {x["field"]: x["counts"] for x in r["facets"]}
print(f"GBIF, {STRAAL:g} km rond {LAT}, {LON}, jaren {JAREN.replace(',', '-')}: {r['count']} waarnemingen, {len(f['SPECIES_KEY'])} soorten")
print("  per groep:", ", ".join(f"{naam(c['name'])[0]} {c['count']}" for c in f["CLASS_KEY"][:5]))
print("  uit:", ", ".join(f"{get(f'{GBIF}/dataset/{d['name']}')['title'][:40]} ({d['count'] / r['count']:.0%})" for d in f["DATASET_KEY"][:3]))
print("  meest gezien:")
for s in f["SPECIES_KEY"][:8]:
    nl, wet = naam(s["name"])
    print(f"    {s['count']:6}  {nl} ({wet})")

# 2. Waarneming.nl (Observation.org) staat in GBIF met coördinaten afgerond op 0,05 graad: zoek je eigen cel.
cel = (math.floor(LAT * 20) / 20, math.floor(LON * 20) / 20)
o = get(f"{GBIF}/occurrence/search", datasetKey="8a863029-f435-446a-821e-275f4f641165", decimalLatitude=cel[0],
        decimalLongitude=cel[1], year=JAREN, occurrenceStatus="PRESENT", limit=0, facet="speciesKey", facetLimit=10000)
print(f"\nWaarneming.nl in het vak {cel[0]:.2f}-{cel[0] + .05:.2f} N, {cel[1]:.2f}-{cel[1] + .05:.2f} O (ongeveer 5,6 bij 3,4 km): "
      f"{o['count']} waarnemingen, {len(o['facets'][0]['counts']) if o['facets'] else 0} soorten")

# 3. Natura 2000 binnen 10 km (PDOK WFS; deze MapServer geeft altijd de hele omtrek mee, dus bbox klein houden).
dy, dx = 10 / 111.32, 10 / (111.32 * math.cos(math.radians(LAT)))
n2k = get("https://service.pdok.nl/rvo/natura2000/wfs/v1_0", service="WFS", version="2.0.0", request="GetFeature",
          typeNames="natura2000:natura2000", outputFormat="application/json", srsName="EPSG:4326",
          bbox=f"{LAT - dy},{LON - dx},{LAT + dy},{LON + dx},urn:ogc:def:crs:EPSG::4326")["features"]
def km(p, q):
    return 111.32 * math.hypot((p[0] - q[0]) * math.cos(math.radians(LAT)), p[1] - q[1])
def afstand(geom):   # 0 als het punt erin ligt, anders de afstand tot de dichtstbijzijnde rand (benadering)
    vlakken = geom["coordinates"] if geom["type"] == "MultiPolygon" else [geom["coordinates"]]
    binnen, d = False, float("inf")
    for vlak in vlakken:
        for ring in vlak:
            for (x1, y1), (x2, y2) in zip(ring, ring[1:]):
                if (y1 > LAT) != (y2 > LAT) and LON < x1 + (LAT - y1) * (x2 - x1) / (y2 - y1):
                    binnen = not binnen
                d = min(d, km((LON, LAT), (x1, y1)))
    return 0.0 if binnen else d
gebieden = {}   # één gebied (nr) kan uit meerdere objecten bestaan: Vogelrichtlijn, Habitatrichtlijn of beide
for g in n2k:
    p, a = g["properties"], afstand(g["geometry"])
    oud = gebieden.get(p["nr"], (p["naamN2K"], float("inf"), set()))
    gebieden[p["nr"]] = (p["naamN2K"], min(oud[1], a), oud[2] | set(p["beschermin"].split("+")))
print(f"\nNatura 2000 binnen 10 km: {len(gebieden) or 'geen'}")
for nm, a, r in sorted(gebieden.values(), key=lambda x: x[1]):
    print(f"  {nm} ({'+'.join(sorted(r))}): {'je staat erin' if a == 0 else f'{a:.1f} km'}")

# 4. Hoe groen: ESA WorldCover 2021 (10 m) via Microsoft Planetary Computer, histogram binnen een cirkel.
item = requests.post("https://planetarycomputer.microsoft.com/api/stac/v1/search", headers=UA, timeout=120, json={
    "collections": ["esa-worldcover"], "intersects": {"type": "Point", "coordinates": [LON, LAT]}}).json()["features"]
item = max(item, key=lambda i: i["properties"]["esa_worldcover:product_version"])   # 2021 (v200) boven 2020 (v100)
klassen = {c["value"]: c["description"] for c in item["assets"]["map"]["classification:classes"]}
ring = [[LON + STRAAL / (111.32 * math.cos(math.radians(LAT))) * math.sin(2 * math.pi * i / 64),
         LAT + STRAAL / 111.32 * math.cos(2 * math.pi * i / 64)] for i in range(65)]
st = requests.post("https://planetarycomputer.microsoft.com/api/data/v1/item/statistics", headers=UA, timeout=120,
                   params={"collection": "esa-worldcover", "item": item["id"], "assets": "map", "categorical": "true", "max_size": 1024},
                   json={"type": "Feature", "properties": {}, "geometry": {"type": "Polygon", "coordinates": [ring]}}).json()
aantallen, waarden = st["properties"]["statistics"]["map_b1"]["histogram"]
totaal = sum(aantallen)
print(f"\nGrondgebruik binnen {STRAAL:g} km ({item['id']}):")
for n, w in sorted(zip(aantallen, waarden), reverse=True):
    print(f"  {n / totaal:6.1%}  {klassen[int(w)]}")
groen = sum(n for n, w in zip(aantallen, waarden) if int(w) in (10, 20, 30, 90, 95, 100))
print(f"  groen (bomen, struiken, gras, moeras, mos): {groen / totaal:.0%}")
$ python buurt.py
GBIF, 1 km rond 52.358, 4.8686, jaren 2021-2025: 21279 waarnemingen, 486 soorten
  per groep: vogels 20138, Magnoliopsida 735, insecten 208, Liliopsida 99, Agaricomycetes 37
  uit: EOD – eBird Observation Dataset (83%), iNaturalist Research-grade Observations (11%), Birda - Global Observation Dataset (2%)
  meest gezien:
      1168  meerkoet (Fulica atra)
      1161  halsbandparkiet (Psittacula krameri)
      1068  nijlgans (Alopochen aegyptiaca)
      1061  waterhoen (Gallinula chloropus)
       950  ekster (Pica pica)
       949  wilde eend (Anas platyrhynchos)
       903  blauwe reiger (Ardea cinerea)
       885  kraai (Corvus corone)

Waarneming.nl in het vak 52.35-52.40 N, 4.85-4.90 O (ongeveer 5,6 bij 3,4 km): 64595 waarnemingen, 2444 soorten

Natura 2000 binnen 10 km: 3
  Markermeer & IJmeer (VR): 7.6 km
  Ilperveld, Varkensland, Oostzanerveld & Twiske (HR+VR): 8.7 km
  Polder Westzaan (HR): 10.0 km

Grondgebruik binnen 1 km (ESA_WorldCover_10m_2021_v200_N51E003):
   65.7%  Built-up
   28.5%  Tree cover
    2.7%  Grassland
    2.6%  Permanent water bodies
    0.4%  Cropland
    0.1%  Herbaceous wetland
  groen (bomen, struiken, gras, moeras, mos): 31%

$ python buurt.py 52.040 5.690
GBIF, 1 km rond 52.04, 5.69, jaren 2021-2025: 399 waarnemingen, 236 soorten
  per groep: Magnoliopsida 117, insecten 116, vogels 105, Agaricomycetes 20, spinachtigen 13
  uit: iNaturalist Research-grade Observations (58%), Pl@ntNet automatically identified occurr (19%), EOD – eBird Observation Dataset (15%)
  meest gezien:
        10  merel (Turdus merula)
        10  beuk (Fagus sylvatica)
         8  vink (Fringilla coelebs)
         6  roodborst (Erithacus rubecula)
         6  blauwe bosbes (Vaccinium myrtillus)
         6  roodborsttapuit (Saxicola rubicola)
         6  look-zonder-look (Alliaria petiolata)
         5  pimpelmees (Cyanistes caeruleus)

Waarneming.nl in het vak 52.00-52.05 N, 5.65-5.70 O (ongeveer 5,5 bij 3,4 km): 128692 waarnemingen, 3302 soorten

Natura 2000 binnen 10 km: 3
  Veluwe (HR+VR): 0.3 km
  Binnenveld (HR): 6.9 km
  Rijntakken (HR+VR): 8.2 km

Grondgebruik binnen 1 km (ESA_WorldCover_10m_2021_v200_N51E003):
   75.0%  Tree cover
   14.3%  Built-up
   10.3%  Grassland
    0.3%  Cropland
    0.1%  Bare / sparse vegetation
    0.0%  Herbaceous wetland
    0.0%  Shrubland
  groen (bomen, struiken, gras, moeras, mos): 85%
Where it goes wrong
- Observations measure people, not nature. The Vondelpark (31% green) had 21,279 observations of 486 species within 1 km, a point in Ede by the Veluwe (85% green) 399 of 236. Never show the species count as a 'biodiversity score' without saying how many observations are behind it.
- Waarneming.nl seems to be missing, but it is there: Observation.org rounds coordinates in GBIF to 0.05-degree cells (floor(coord * 20) / 20, uncertainty 5,000 m). So you almost never find them within 1 km. Request the cell separately with exact decimalLatitude and decimalLongitude and say that it covers an area of about 5.6 by 3.4 km.
- Birds dominate because of eBird: around the Vondelpark 95% of observations were birds and 83% came from eBird, often with the same species on every checklist. So also show the number of species per group, not just the number of observations, and consider showing birds separately.
- Licences differ per dataset. eBird and Pl@ntNet are CC BY 4.0, but iNaturalist, Birda and Observation.org are CC BY-NC 4.0. Showing counts is usually fine; passing on records or putting them in a commercial app is not. Credit the datasets and make a GBIF download with a DOI for publications.
- The PDOK Natura 2000 WFS always returns the full outline: 7.0 MB for a 20 by 20 km box around Ede. Ask for a small bbox, cache the response and merge features with the same nr (Rijntakken came back twice, as VR and as VR+HR). Also mind the order: in EPSG:4326 the bbox is latitude,longitude.
- GeoJSON and GBIF use a different order: geoDistance is latitude,longitude, GeoJSON coordinates are [longitude, latitude]. A swapped point in the Netherlands lands in the Indian Ocean and simply returns 0 results, without an error.
- WorldCover is the 2021 state, from a model: small errors like 0.4% 'cropland' around the Vondelpark come with it, and new buildings or greenery after 2021 do not show. Use it for proportions, not for single pixels.
Take it further
- Season calendar: use facet=month per group to find out when butterflies, birds or fungi are seen in your neighbourhood, and show a calendar of 'what you can see now'.
- Green per neighbourhood: use the CBS/PDOK neighbourhood boundaries instead of a circle and map all neighbourhoods in your municipality with the share of trees, grass and built-up land. Put that next to the number of residents per neighbourhood.
- Track invasive species: count the rose-ringed parakeet, Egyptian goose or brown marmorated stink bug per year (facet=year) in your neighbourhood and show how fast they spread, noting that more and more people are reporting observations too.
- Missing species: compare your neighbourhood's species list with that of the nearest Natura 2000 site and show which species were seen there but not near you, as a tip for a walk.
More with this data
Records of plants and animals from the Netherlands in GBIF: 12.5 million records in 2025, 24 times as much as in 1990
Records of plants and animals from the Netherlands in GBIF, 1990 – 2025, in million records. That is the highest point in the series.
Land cover of the Randstad (area between Amsterdam, The Hague, Rotterdam and Utrecht): grassland is the largest part, 41% in 2021
Breakdown in 2021: grassland 41%, built-up 19%, tree cover 17%, water 15%, cropland 6.9%, other (herbaceous wetland, bare or sparse vegetation) 0.9%. Total: 572,416 pixels.
Natura 2000 sites by EU directive: Habitats Directive only is the largest part, 52% in January 2026
Breakdown in January 2026: Habitats Directive only 52%, both directives 35%, Birds Directive only 14%. Total: 162 sites.
The sources3
GBIF biodiversity
Over 150 million species observations in the Netherlands, including from waarneming.nl and museum collections.
ESA WorldCover
A map of the whole earth in eleven land cover classes (forest, cropland, built-up, water …), based on Sentinel-1 and -2. Two editions, no new ones planned.
Natura 2000 sites
The official boundaries of all Natura 2000 sites in the Netherlands: the nature protected under the EU Birds Directive and Habitats Directive. There are 162 sites, three of them in the North Sea. Each site has its number, the European site code, the type of protection and the designation decision. Via PDOK as WFS, OGC API and download.
More to build
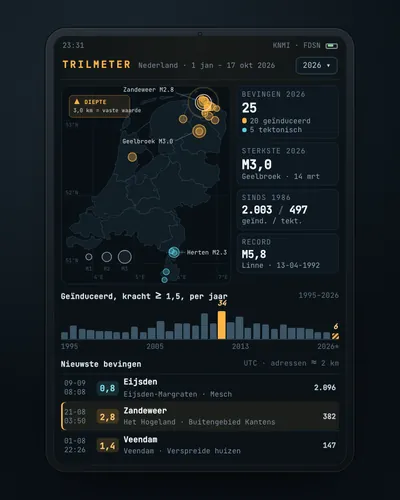 Earthquake tracker: every quake on the map, with municipality and homesMap
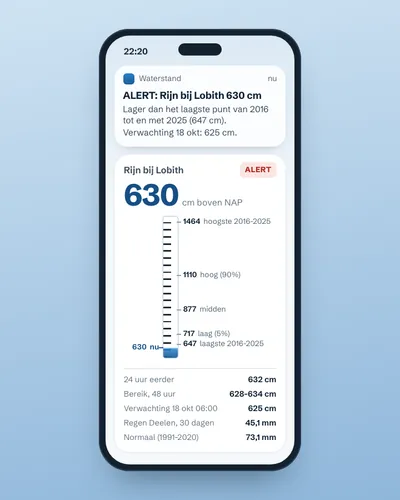 Alert when the river near you is too high or too lowAlert
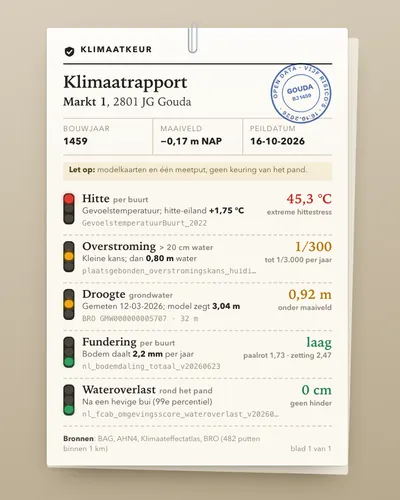 Climate risk check for an addressTool
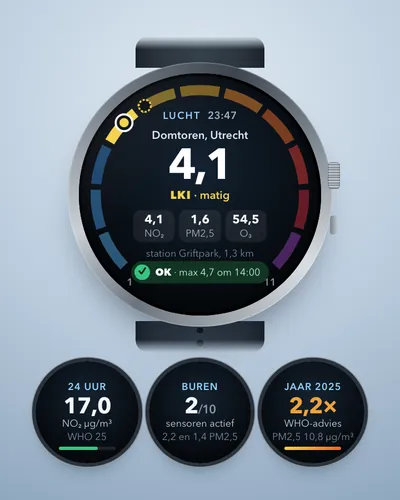 Air quality alert for your own streetAlert
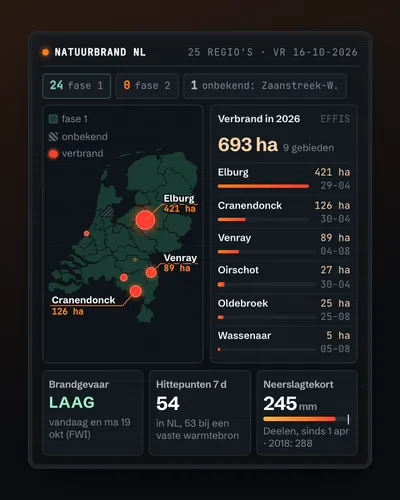 Wildfire map: today's risk, hotspots and burnt landMap
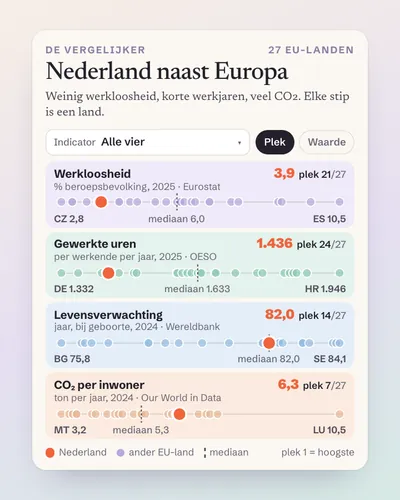 The Netherlands next to Europe: a comparison tool for any indicatorTool