Air quality alert for your own street
A notification on your phone when the air at home is bad or about to get bad, based on the Luchtmeetnet forecast, the monitoring stations in your city, neighbours' sensors and the RIVM annual map.
geef_project("luchtkwaliteit-alert")geef_bron("luchtmeetnet")geef_bron("rivm-samenmeten")geef_bron("rivm-gcn")
I have the project, the tested calls and the pitfalls. I'll build a alert with Luchtmeetnet air quality network, Samen Meten (RIVM), Large-scale concentration maps (GCN) and KNMI daily weather data. This is how it could look:
You build this yourself. Copy the prompt into Claude, ChatGPT or Cursor, with the MCP server on, or follow the steps below.
This is a mockup, not a working version, with the figures from our test run at the Dom Tower in Utrecht on 16 October 2026, 23:47 (Luchtmeetnet, RIVM Samen Meten and the RIVM 2025 annual map). Turn the MCP server on with the address on For AI.
Who it's for
People with asthma or COPD and those around them, parents who want to know whether playing outside or running is a good idea, neighbourhood groups with their own sensors, and makers who want to build a first real alert app.
What you get
A script (and then an app or bot) that checks four things for one place every hour and says "ALERT" or "OK": the forecast air quality index (LKI) at your point for the next day, the latest hourly values at the official monitoring stations in your city, the calibrated particulate value from citizen sensors within 500 metres, and the modelled annual mean at your location next to the WHO guideline.
Test run on 16 October 2026, 21:47 UTC, at the Dom tower in Utrecht: forecast LKI 4.1 now and at most 4.7 (17 October 12:00 UTC), ozone at most 75 µg/m³ (information threshold 180). At Utrecht-Griftpark (1.3 km) the LKI was 4, nitrogen dioxide (NO2) 4.1 and particulate matter (PM2.5) 1.6 µg/m³ in the hour to 21:00 UTC; over 24 hours the average was 17.0 µg/m³ NO2 (WHO guideline 25) and 5.2 µg/m³ PM2.5 (WHO guideline 15). Of the 10 Samen Meten points within 500 metres only 2 gave a recent value (2.2 and 1.4 µg/m³ PM2.5). The 2025 annual mean at that spot according to the RIVM map: NO2 18.5, PM2.5 10.8 and PM10 18.5 µg/m³, so 1.8, 2.2 and 1.2 times the WHO annual guideline. Result: "OK". A calm evening with wind, but on a yearly basis this spot is above the WHO guideline too.
Nitrogen dioxide in 2025: highest in the Randstad and along motorways, lowest in the north
The modelled annual mean NO2 for 2025 in one-kilometre squares, from RIVM's map service. According to the service's classes, the lightest blue is below 10 micrograms per cubic metre, which covers most of Friesland, Groningen and Drenthe. The Randstad is darker, motorways show up as lines and the darkest patches are around Rotterdam, The Hague and Amsterdam. It is a modelled map based on measurements and models; query a single point with GetFeatureInfo.
How you could start8 steps
- 1
Ask for the forecast at your own point
Luchtmeetnet has a little-known endpoint that returns current and predicted values for one coordinate (the API documentation says "current and predicted concentrations"): LKI, NO2, O3 or PM10. You get a value per hour from the last full hour to about 19 hours ahead; the model values change in blocks of three hours. This is the core of an alert: you can warn before it gets bad. No pagination, no key. Latitude and longitude in WGS84 (ordinary GPS degrees). Times are UTC; in summer time 21:00 UTC is 23:00 in the Netherlands.
https://api.luchtmeetnet.nl/open_api/concentrations?formula=LKI&latitude=52.0907&longitude=5.1213
{"data": [ {"formula":"LKI","value":4.070000171661377,"timestamp_measured":"2026-10-16T21:00:00+00:00"}, {"formula":"LKI","value":4.070000171661377,"timestamp_measured":"2026-10-16T22:00:00+00:00"}, {"formula":"LKI","value":4.070000171661377,"timestamp_measured":"2026-10-16T23:00:00+00:00"}, {"formula":"LKI","value":3.549999952316284,"timestamp_measured":"2026-10-17T00:00:00+00:00"}, ...]} (20 uren, tot 2026-10-17T16:00) - 2
Fix the thresholds, with their source
RIVM's air quality index (LKI) runs from 1 to 11 and has five classes: good (1 to 3), moderate (4 to 6), insufficient (7 and 8), bad (9 and 10) and very bad (11). Dutch Teletext page 711 (source RIVM) put the index at 5 at 23:00 on 16 October, in the "moderate" column. Which concentration belongs to which index number comes from the API itself: /components/<pollutant> has a `limits` list with a lower and upper bound in µg/m³ per index number (NO2: index 4 is 30 to 45; O3: index 9 starts at 180, the European information threshold, and 11 at 240, the alert threshold). For the long term, add the 2021 WHO guidelines: 24 hours NO2 25, PM2.5 15, PM10 45; annual NO2 10, PM2.5 5, PM10 15 µg/m³. The legal EU annual limit is in the pollutant's description (NO2 40, PM2.5 25). Ignore the colour codes in `limits`: they are inconsistent (index 5 has the same colour as index 2).
https://api.luchtmeetnet.nl/open_api/components/O3
{"data": {"formula": "O3", "description": {"NL": "... In heel Europa wordt de bevolking gewaarschuwd bij ozonconcentraties boven 180 (μg/m3). Een concentratie van 240 (μg/m3) is de Europese alarmdrempel. ..."}, "limits": [{"rating": 1, "lowerband": null, "upperband": 15, ...}, ... {"rating": 8, "lowerband": 140, "upperband": 180, ...}, {"rating": 9, "lowerband": 180, "upperband": 200, ...}, {"rating": 10, "lowerband": 200, "upperband": 240, ...}, {"rating": 11, "lowerband": 240, "upperband": 10000, ...}]}} - 3
Find the monitoring stations in your city
The station list (/stations, 5 pages) only gives number and location name. Position, type (Traffic, Municipal = urban background, Regional = rural) and which pollutants the station measures are only in /stations/<number>. Always take names and positions from there, never from memory (we once mixed up Stadhouderskade and Vondelpark). Compute the distance to your point yourself. A traffic station tells you about a busy street, an urban background station about the surrounding neighbourhood.
https://api.luchtmeetnet.nl/open_api/stations/NL10643
{"data": {"type": "Municipal", "components": ["PM25", "NO", "O3", "NO2"], "geometry": {"type": "point", "coordinates": [5.128183, 52.101308]}, "municipality": "Utrecht", "organisation": "RIVM", "location": "Utrecht-Griftpark", ...}} - 4
Fetch the index for all stations at once
Set start and end to the same full hour (UTC) and you get the LKI of all roughly 97 stations in one response. The same works for /measurements with a formula (NO2: 86 stations). `timestamp_measured` is the end of the hour: 21:00 is the average from 20:00 to 21:00. Note: a station's LKI is the highest index number of the pollutants it measures. Utrecht-Kardinaal de Jongweg measures no ozone and scored 1, Griftpark with ozone scored 4. So do not compare stations blindly on their LKI.
https://api.luchtmeetnet.nl/open_api/lki?start=2026-10-16T21:00:00Z&end=2026-10-16T21:00:00Z
{"pagination": {"last_page": 1, "current_page": 1, ...}, "data": [{"station_number":"NL49565","formula":"LKI","value":2,"timestamp_measured":"2026-10-16T21:00:00+00:00"}, {"station_number":"NL53020","formula":"LKI","value":1,"timestamp_measured":"2026-10-16T21:00:00+00:00"}, ... {"station_number":"NL10636","formula":"LKI","value":1,"timestamp_measured":"2026-10-16T21:00:00+00:00"}, {"station_number":"NL10643","formula":"LKI","value":4,"timestamp_measured":"2026-10-16T21:00:00+00:00"}, ...]} (97 stations) - 5
Compute a 24-hour mean for the WHO guideline
The WHO guideline applies to a daily mean, not a single hour. Request the last 24 hourly values of the nearest station that measures the pollutant. At most one week per request: ask for more and the API answers with a 302 to an address with a silently shortened start (we asked for 1 to 16 October and got 9 to 16 October). Values are provisional and unvalidated. According to the documentation you may make 100 requests per 5 minutes.
https://api.luchtmeetnet.nl/open_api/measurements?station_number=NL10643&formula=PM25&start=2026-10-15T22:00:00Z&end=2026-10-16T21:00:00Z&order_by=timestamp_measured&order_direction=desc
{"pagination": {"last_page": 1, ...}, "data": [{"station_number":"NL10643","value":1.61,"timestamp_measured":"2026-10-16T21:00:00+00:00","formula":"PM25", "timestamp_measured_start":"2026-10-16T20:00:00+00:00","timestamp_measured_end":"2026-10-16T21:00:00+00:00"}, {"station_number":"NL10643","value":0.95,"timestamp_measured":"2026-10-16T20:00:00+00:00", ...}, {"station_number":"NL10643","value":0.66,"timestamp_measured":"2026-10-16T19:00:00+00:00", ...}, ...]} (24 uren) - 6
Look at citizen sensors in your street
Samen Meten (RIVM) is a SensorThings API with over 12,000 measuring points. Find points around your location with geo.distance; the distance is in degrees (0.005 degree is about 550 metres north-south and 340 metres east-west) and the geography must include `SRID=4326`. Locations also holds old positions of moved or mobile boxes: near the Dam in Amsterdam, 33 locations within 0.005 degree gave not a single recent value (mostly old positions of Hollandse Luchten boxes). Near the Dom in Utrecht: 10 points, of which 2 (Meetjestad) had a value from that hour.
https://api-samenmeten.rivm.nl/v1.0/Locations?$filter=geo.distance(location,geography'SRID=4326;POINT(5.1213 52.0907)') le 0.005&$select=location&$expand=Things($select=id,name)&$top=100
{"value": [ {"location": {"coordinates": [5.121, 52.09], ...}, "Things": [{"@iot.id": 11446, "name": "SMU_350976650159780"}]}, {"location": {"coordinates": [5.123, 52.087], ...}, "Things": [{"@iot.id": 9524, "name": "MJS_1000"}]}, {"location": {"coordinates": [5.122, 52.086], ...}, "Things": [{"@iot.id": 7473, "name": "LTD_67490"}]}, ...]} (10 meetpunten) - 7
Only take the calibrated, recent value
For each point request the `pm25_kal` series (calibrated by RIVM) with its latest value. Never use the raw `pm25`: cheap sensors drift a lot at high humidity. Check the time: of the 10 points near the Dom, 8 had their last value between June 2019 and August 2026. Broad queries (an $expand of Observations over many points at once, or a filter on Thing/Locations from Datastreams) gave a 504 or an empty reply: work per point and count on about 2 seconds per call. Every point names its nearest Luchtmeetnet station (`pm25closecode`) and KNMI station (`knmicode`).
https://api-samenmeten.rivm.nl/v1.0/Things(9524)/Datastreams?$filter=endswith(name,'pm25_kal')&$select=name&$expand=Observations($top=3;$orderby=phenomenonTime desc;$select=phenomenonTime,result)
{"value": [{"name": "MJS_1000-12-pm25_kal", "Observations": [{"phenomenonTime": "2026-10-16T20:00:00.000Z", "result": 2.1511495}, {"phenomenonTime": "2026-10-16T19:00:00.000Z", "result": 1.3685033}, {"phenomenonTime": "2026-10-16T18:00:00.000Z", "result": 0.4082183}]}]} Things(9524): "properties": {"project": "Meetjestad", "pm25closecode": "NL10643", "knmicode": "knmi_06260", ...} - 8
Add the annual mean at your location
An alert is about today, but most health damage comes from the annual mean. RIVM's large-scale concentration maps (GCN) give the modelled annual mean per 1 km cell. Ask for the value at your point with WMS GetFeatureInfo. Layer names are case sensitive: `conc_NO2_2025` works, `conc_no2_2025` returns "LayerNotDefined". In WMS 1.3.0 with EPSG:4326 the bbox order is latitude,longitude. Outside the Netherlands (at sea) you get an empty `features` list.
https://data.rivm.nl/geo/gcn/wms?service=WMS&version=1.3.0&request=GetFeatureInfo&layers=conc_PM25_2025&query_layers=conc_PM25_2025&styles=&crs=EPSG:4326&bbox=52.0897,5.1203,52.0917,5.1223&width=3&height=3&i=1&j=1&info_format=application/json
{"type":"FeatureCollection","features":[{"type":"Feature","id":"","geometry":null,
  "properties":{"conc_PM25_2025":10.85}}],"totalFeatures":"unknown","numberReturned":1,
  "timeStamp":"2026-10-16T21:46:32.483Z","crs":null}
How the sources fit together
- Samen Meten (RIVM)Luchtmeetnet air quality networkvia
pm25closecode / no2closecode (stationsnummer, bv. NL10643)Every Samen Meten point names its nearest official station. MJS_1000 near the Dom points to NL10643 (Utrecht-Griftpark). Fetch the same hour there to see whether the sensor is roughly right before you base a notification on it.
- Luchtmeetnet air quality networkLarge-scale concentration maps (GCN)via
coördinaten (WGS84)The same latitude and longitude you pass to /concentrations go into GetFeatureInfo on the GCN map. That puts today's forecast and the annual mean for the same spot side by side.
- Samen Meten (RIVM)KNMI daily weather datavia
knmicode (knmi_06260 = station 260, De Bilt)Afterwards, put wind speed (FH per hour, FG per day) next to your notifications: still evenings give high values more often. Note: on 16 October 2026 the KNMI daily and hourly data ran up to 14 October, so this is too late for the alert itself but fine for analysis.
Let AI build it
Paste this prompt into Claude, ChatGPT, Cursor or Lovable. It names the real endpoints, the join keys and the pitfalls, so the assistant writes working code straight away. Always check the result against the source itself.
Build an air quality alert for one address in the Netherlands: a small Python (or Node) script that runs every hour and
sends a push notification (for example via ntfy.sh or Telegram) when the air is bad or is about to get bad in the coming
hours. Then a simple web page with the current state. All without an API key. Send an honest User-Agent
("my-project/1.0 (+you@example.com)").

Sources and endpoints (all tested on 16 October 2026):
1. Forecast at your point (Luchtmeetnet): GET https://api.luchtmeetnet.nl/open_api/concentrations?formula=LKI&latitude=52.0907&longitude=5.1213
   formula can be LKI, NO2, O3 or PM10. Response {"data":[{"formula","value","timestamp_measured"}]}, about 20 hours
   from the last full hour, values with decimals, equal in blocks of 3 hours. No pagination.
2. Index of all stations for one hour: GET https://api.luchtmeetnet.nl/open_api/lki?start=2026-10-16T21:00:00Z&end=2026-10-16T21:00:00Z
   (97 stations in one response). Hourly values: /open_api/measurements?formula=NO2&start=…&end=… (same hour = all
   stations), or with station_number for one station.
3. Stations: /open_api/stations?page=1..5 (only number and location), details with position, type and measured
   pollutants in /open_api/stations/<number>, e.g. NL10643 = Utrecht-Griftpark. Always take names from here.
4. Thresholds per pollutant: /open_api/components/<NO2|O3|PM25|PM10|LKI> returns `limits`: for each index number 1 to 11
   a lowerband and upperband in µg/m³. Ignore the colours in it (inconsistent).
5. Citizen sensors (RIVM Samen Meten, SensorThings):
   GET https://api-samenmeten.rivm.nl/v1.0/Locations?$filter=geo.distance(location,geography'SRID=4326;POINT(<lon> <lat>)') le 0.005&$expand=Things($select=id,name)&$top=100
   and per Thing: /v1.0/Things(<id>)/Datastreams?$filter=endswith(name,'pm25_kal')&$expand=Observations($top=1;$orderby=phenomenonTime desc)
6. Annual mean (RIVM GCN, 1 km): WMS GetFeatureInfo on https://data.rivm.nl/geo/gcn/wms with layers=conc_NO2_2025
   (also conc_PM25_2025, conc_PM10_2025), version=1.3.0, crs=EPSG:4326, bbox=<lat-0.001>,<lon-0.001>,<lat+0.001>,<lon+0.001>,
   width=3, height=3, i=1, j=1, info_format=application/json. Value in features[0].properties[<layer name>].

Thresholds for the notification:
- RIVM LKI: 1 to 3 good, 4 to 6 moderate, 7 and 8 insufficient, 9 and 10 bad, 11 very bad. Notify from 7 (configurable;
  people with lung disease may want 6).
- Ozone: EU information threshold 180 µg/m³ (hourly mean), alert threshold 240.
- WHO guidelines 2021: 24 hours NO2 25, PM2.5 15, PM10 45; annual NO2 10, PM2.5 5, PM10 15 µg/m³. EU annual limit NO2 40, PM2.5 25.

Pitfalls to handle:
- All times are UTC. timestamp_measured is the end of the hour (21:00 = 20:00 to 21:00). Show Dutch local time.
- Luchtmeetnet: at most 7 days per request; ask for more and you get a 302 with a silently shortened start. Follow
  redirects and check the range. At most 100 requests per 5 minutes. Hourly values are provisional.
- The latest hour is sometimes not in yet: try the hour before if the list is empty.
- A station's LKI is the maximum over the pollutants it measures; a station without ozone often scores lower.
- Not every station measures every pollutant: check components in /stations/<number>.
- Samen Meten: only use pm25_kal and pm10_kal, never the raw pm25/pm10. Only take values from the last 3 hours (many
  points have been silent for years). Locations includes old positions of moved boxes. geo.distance works in degrees.
  $top at most 200. Broad $expand queries return 504 or an empty reply: query per point, and cache.
- Never let one sensor decide on its own: say "according to sensors nearby" and compare with pm25closecode.
- GCN: layer names are case sensitive; outside the map you get an empty features list.
- Do not send the same notification every hour: only on a change from OK to ALERT, and once "back to good".

Output: a script with configurable location and thresholds, a notification with a short sentence ("Tomorrow 14:00
forecast: LKI 7, insufficient. Mainly ozone."), and a page with the forecast as a line, the stations by distance and
the annual mean next to the WHO guideline. State under everything: source Luchtmeetnet and RIVM, provisional data.
Try it yourself
The core of the project in a small script. Needs: Python 3.10+ en requests. Tested on 2026-10-16; below is the real output of that run.
# Luchtkwaliteit-alert voor je eigen plek. Geen sleutel nodig.
# Bronnen: Luchtmeetnet (verwachting op je punt + metingen van stations), RIVM Samen Meten (sensoren van burgers),
# RIVM GCN (berekend jaargemiddelde 2025). Luchtmeetnet staat 100 verzoeken per 5 minuten toe: dit script doet er ~16.
import math, requests
from datetime import datetime, timedelta, timezone

UA = {"User-Agent": "mijn-project/1.0 (+jij@voorbeeld.nl)"}
LON, LAT, STAD = 5.1213, 52.0907, "Utrecht"   # de Domtoren; zet hier je eigen plek
LM = "https://api.luchtmeetnet.nl/open_api"
SM = "https://api-samenmeten.rivm.nl/v1.0"

# Drempels met herkomst. LKI-banden en ozon-informatiedrempel staan in de API zelf (/components/<stof>).
LKI_ALERT = 7          # LKI 7 of hoger: 'onvoldoende' of slechter (5 klassen, schaal 1 tot 11, RIVM)
O3_INFO = 180          # EU-informatiedrempel ozon, uurgemiddelde (ook genoemd in /components/O3)
WHO_24U = {"NO2": 25, "PM25": 15, "PM10": 45}   # WHO-advies 2021, 24-uursgemiddelde in µg/m³
WHO_JAAR = {"NO2": 10, "PM25": 5, "PM10": 15}   # WHO-advies 2021, jaargemiddelde in µg/m³

def get(url, **params):
    r = requests.get(url, params=params, headers=UA, timeout=60)
    r.raise_for_status()
    return r.json()

def km(lon1, lat1, lon2, lat2):
    return 6371 * math.hypot(math.radians(lon2 - lon1) * math.cos(math.radians(lat1)), math.radians(lat2 - lat1))

def iso(t):
    return t.strftime("%Y-%m-%dT%H:%M:%SZ")

meldingen = []

# 1. Verwachting op je punt (huidig uur + ~19 uur vooruit), formula LKI, NO2, O3 of PM10.
verw = {f: get(f"{LM}/concentrations", formula=f, latitude=LAT, longitude=LON)["data"] for f in ["LKI", "O3"]}
lki = verw["LKI"]
piek = max(lki, key=lambda x: x["value"])
print(f"1. Verwachting op {LAT}, {LON} (Luchtmeetnet, model)")
print(f"   LKI nu {lki[0]['value']:.1f} ({lki[0]['timestamp_measured'][:16]} UTC), hoogste {piek['value']:.1f} om {piek['timestamp_measured'][:16]} UTC")
o3max = max(x["value"] for x in verw["O3"])
print(f"   ozon hoogste verwachte uurwaarde {o3max:.0f} µg/m³ (informatiedrempel {O3_INFO})")
if piek["value"] >= LKI_ALERT: meldingen.append(f"verwachte LKI {piek['value']:.1f} op je plek")
if o3max >= O3_INFO: meldingen.append(f"verwachte ozon {o3max:.0f} µg/m³")

# 2. Stations in je stad: namen en ligging uit /stations/<nummer> (de lijst heeft alleen nummer en locatie-tekst).
lijst, pagina = [], 1
while True:
    j = get(f"{LM}/stations", page=pagina)
    lijst += j["data"]
    if pagina >= j["pagination"]["last_page"]: break
    pagina += 1
stations = {}
for s in lijst:
    if s["location"].replace(" ", "").startswith(STAD + "-"):
        d = get(f"{LM}/stations/{s['number']}")["data"]
        lon, lat = d["geometry"]["coordinates"]
        stations[s["number"]] = {"naam": d["location"], "soort": d["type"], "km": km(LON, LAT, lon, lat), "stoffen": d["components"]}

# Laatste volle uur waarvoor de LKI er is (één verzoek geeft alle ~97 stations).
uur = datetime.now(timezone.utc).replace(minute=0, second=0, microsecond=0)
for _ in range(6):
    alle_lki = get(f"{LM}/lki", start=iso(uur), end=iso(uur))["data"]
    if alle_lki: break
    uur -= timedelta(hours=1)
lki_st = {x["station_number"]: x["value"] for x in alle_lki}
uurwaarde = {}
for f in ["NO2", "PM25", "O3"]:
    for x in get(f"{LM}/measurements", formula=f, start=iso(uur), end=iso(uur))["data"]:
        uurwaarde[(x["station_number"], f)] = x["value"]

print(f"\n2. Stations in {STAD}, uur tot {uur:%d-%m %H:%M} UTC (voorlopige uurwaarden, µg/m³)")
print(f"   {'afstand':>7}  {'station':30} {'soort':10} {'LKI':>3} {'NO2':>5} {'PM2,5':>5} {'O3':>5}")
dichtbij = sorted(stations.items(), key=lambda kv: kv[1]["km"])
for nr, s in dichtbij:
    w = [uurwaarde.get((nr, f)) for f in ["NO2", "PM25", "O3"]]
    tekst = ["   -" if v is None else f"{v:5.1f}" for v in w]
    print(f"   {s['km']:5.1f} km  {s['naam']:30} {s['soort']:10} {lki_st.get(nr, '-'):>3} {' '.join(tekst)}")
for nr, s in dichtbij[:3]:
    if lki_st.get(nr, 0) >= LKI_ALERT: meldingen.append(f"LKI {lki_st[nr]} op {s['naam']}")

# 24-uursgemiddelde op het dichtstbijzijnde station dat de stof meet, tegen het WHO-advies.
print("\n   24-uursgemiddelde, dichtstbijzijnde station dat de stof meet:")
for f in ["NO2", "PM25"]:
    nr, s = next((nr, s) for nr, s in dichtbij if f in s["stoffen"])
    m = get(f"{LM}/measurements", station_number=nr, formula=f, start=iso(uur - timedelta(hours=23)), end=iso(uur))["data"]
    w = [x["value"] for x in m if x["value"] is not None]
    gem = sum(w) / len(w)
    print(f"   {f:4} {s['naam']:30} {gem:5.1f} µg/m³ over {len(w)} uur (WHO-advies 24 uur: {WHO_24U[f]})")
    if gem > WHO_24U[f]: meldingen.append(f"{f} 24-uursgemiddelde {gem:.1f} boven WHO-advies op {s['naam']}")

# 3. Sensoren van burgers binnen ~500 m (geo.distance in graden). Locations bevat ook oude plekken van verplaatste
#    kastjes: houd alleen reeksen met een gekalibreerde PM2,5-waarde van de laatste 3 uur over. ~2 s per meetpunt.
locs = get(f"{SM}/Locations", **{"$filter": f"geo.distance(location,geography'SRID=4326;POINT({LON} {LAT})') le 0.005",
                                   "$expand": "Things($select=id,name)", "$top": 100})["value"]
things = {t["@iot.id"]: t["name"] for loc in locs for t in loc["Things"]}
grens = datetime.now(timezone.utc) - timedelta(hours=3)
pm25 = []
for tid, naam in things.items():
    ds = get(f"{SM}/Things({tid})/Datastreams", **{"$filter": "endswith(name,'pm25_kal')",
             "$expand": "Observations($top=1;$orderby=phenomenonTime desc;$select=phenomenonTime,result)"})["value"]
    for d in ds:
        o = (d.get("Observations") or [None])[0]
        if o and o["result"] is not None and datetime.fromisoformat(o["phenomenonTime"].replace("Z", "+00:00")) >= grens:
            pm25.append((naam, o["result"], o["phenomenonTime"][11:16]))
print(f"\n3. Samen Meten binnen ~500 m: {len(things)} meetpunten, {len(pm25)} met gekalibreerd PM2,5 van de laatste 3 uur")
for naam, w, t in pm25:
    print(f"   {naam:22} {w:5.1f} µg/m³ om {t} UTC (indicatief, geen officiële meting)")

# 4. Berekend jaargemiddelde 2025 op je plek (RIVM GCN, 1 x 1 km). Laagnamen zijn hoofdlettergevoelig.
print("\n4. Jaargemiddelde 2025 op je plek (RIVM GCN):")
for f in ["NO2", "PM25", "PM10"]:
    laag = f"conc_{f}_2025"
    p = get("https://data.rivm.nl/geo/gcn/wms", service="WMS", version="1.3.0", request="GetFeatureInfo", layers=laag,
            query_layers=laag, styles="", crs="EPSG:4326", bbox=f"{LAT-.001},{LON-.001},{LAT+.001},{LON+.001}",
            width=3, height=3, i=1, j=1, info_format="application/json")["features"]
    if not p:
        print(f"   {f:4} geen waarde (punt buiten de kaart)"); continue
    p = p[0]["properties"][laag]
    print(f"   {f:4} {p:5.1f} µg/m³ (WHO-advies jaar: {WHO_JAAR[f]}, {p / WHO_JAAR[f]:.1f} keer zo hoog)")

print("\n" + ("ALERT: " + "; ".join(meldingen) if meldingen else f"OK: geen drempel overschreden (LKI-alert vanaf {LKI_ALERT})"))
1. Verwachting op 52.0907, 5.1213 (Luchtmeetnet, model)
   LKI nu 4.1 (2026-10-16T21:00 UTC), hoogste 4.7 om 2026-10-17T12:00 UTC
   ozon hoogste verwachte uurwaarde 75 µg/m³ (informatiedrempel 180)

2. Stations in Utrecht, uur tot 16-10 21:00 UTC (voorlopige uurwaarden, µg/m³)
   afstand  station                        soort      LKI   NO2 PM2,5    O3
     1.3 km  Utrecht-Griftpark              Municipal    4   4.1   1.6  54.5
     1.6 km  Utrecht-Kardinaal de Jongweg   Traffic      1   5.0   2.0    -
     2.6 km  Utrecht-Constant Erzeijstraat  Traffic      4   5.9    -  59.5

   24-uursgemiddelde, dichtstbijzijnde station dat de stof meet:
   NO2  Utrecht-Griftpark               17.0 µg/m³ over 24 uur (WHO-advies 24 uur: 25)
   PM25 Utrecht-Griftpark                5.2 µg/m³ over 24 uur (WHO-advies 24 uur: 15)

3. Samen Meten binnen ~500 m: 10 meetpunten, 2 met gekalibreerd PM2,5 van de laatste 3 uur
   MJS_1000                 2.2 µg/m³ om 20:00 UTC (indicatief, geen officiële meting)
   MJS_791                  1.4 µg/m³ om 20:00 UTC (indicatief, geen officiële meting)

4. Jaargemiddelde 2025 op je plek (RIVM GCN):
   NO2   18.5 µg/m³ (WHO-advies jaar: 10, 1.8 keer zo hoog)
   PM25  10.8 µg/m³ (WHO-advies jaar: 5, 2.2 keer zo hoog)
   PM10  18.5 µg/m³ (WHO-advies jaar: 15, 1.2 keer zo hoog)

OK: geen drempel overschreden (LKI-alert vanaf 7)
Where it goes wrong
- Asking Luchtmeetnet for more than a week gives no error but a 302 to an address with a shortened start. If you follow redirects blindly you think you have two weeks and you have one. Split long periods into weeks yourself.
- All times are UTC and timestamp_measured is the end of the measuring hour. In summer time the Netherlands is two hours ahead: a notification 'at 21:00' should say 23:00.
- A station's LKI is the highest index number of the pollutants it measures. A traffic station without ozone (Utrecht-Kardinaal de Jongweg: LKI 1) then looks cleaner than a park station with ozone (Griftpark: LKI 4). Use the forecast at your point for the alert, or look per pollutant.
- Samen Meten counts every point ever registered and every old position. Near the Dam in Amsterdam, 33 locations within 500 metres gave no recent value at all; near the Dom in Utrecht 2 out of 10. Filter on a value from the last few hours and only use pm25_kal and pm10_kal.
- Samen Meten gets slow or fails on broad queries: an $expand of Observations over 200 locations gave a 504 after 30 seconds, a filter on Thing/Locations from Datastreams an empty reply. Query per point (about 2 seconds) and cache the list of active points for a day.
- GCN layer names are case sensitive (conc_NO2_2025, not conc_no2_2025) and the bbox in WMS 1.3.0 with EPSG:4326 is latitude,longitude. A point at sea returns an empty features list: handle that.
- An hourly value is not an annual mean. An 'OK' on a windy evening says nothing about the annual limit: at the Dom everything was low, yet the annual PM2.5 mean (10.8) is over twice the WHO guideline. Show both.
Take it further
- Push notification with ntfy.sh or a Telegram bot, once per transition (OK to ALERT and back), with the forecast peak and the pollutant behind it (also request /concentrations for NO2, O3 and PM10 and see which gives the highest index number).
- Is the neighbours' sensor right? Put a week of pm25_kal from one point next to the station from pm25closecode (MJS_1000 next to NL10643) and compute the average deviation. Only use sensors that track well.
- Still air is dirty air: afterwards fetch the hourly wind of the KNMI station from knmicode (hourly data, FH in 0.1 m/s) and show how often an alert coincided with little wind.
- Map of your city: the GCN layer as background (WMS GetMap), the stations with this hour's LKI and the active sensors as dots.
More with this data
Samen Meten measuring points by project: most Luftdaten (6,103 measuring points), then Palmes and Luchtclub
Samen Meten measuring points by project, October 2026, in measuring points. Total: 12,439; the largest 12 of 60 categories are shown. Luftdaten is 49% of the total. A measuring point is a sensor box or, in the Palmes projects, a tube that measures nitrogen dioxide. All points in the API are counted, including those no longer measuring.
Nitrogen dioxide in Amsterdam: highest along the main roads, lowest at the edges of the city
The modelled annual mean NO2 for 2024 from RIVM's map service, for an area of 16 by 12 kilometres around the centre. According to the service's legend, blue is below 14 micrograms per cubic metre and grey 14 to 16; cream and yellow 16 to 20, orange 20 to 30 and red 30 or more. The orange and red lines are the busy roads. It is a modelled map, not a measurement: for a value at your own address, query the map at that point (see the script).
The sources4

Luchtmeetnet air quality networkIn depth
Measurements of nitrogen dioxide, particulate matter and ozone, every hour, from about a hundred stations across the Netherlands.

Samen Meten (RIVM)
Citizens, municipalities and researchers put up their own sensor boxes; RIVM collects their measurements in the Samen Meten data portal and produces calibrated series for particulate matter. On 16 October 2026 the API held 12,419 measuring points with 56,391 data streams: particulate matter (PM10, PM2.5), nitrogen dioxide, ammonia, temperature, humidity and air pressure, per hour. The largest group is Luftdaten (6,099 points).
Large-scale concentration maps (GCN)
Modelled annual averages of nitrogen dioxide and particulate matter for the whole country, in one-kilometre cells. Where Luchtmeetnet measures, GCN fills in between stations.
KNMI daily weather dataIn depth
Daily values from over fifty weather stations: temperature, rainfall, sunshine and wind. The De Bilt series starts in 1901.
More to build
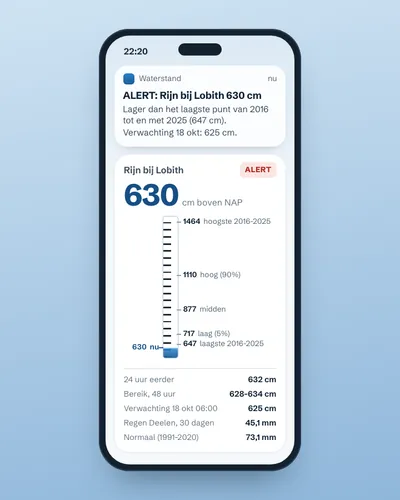 Alert when the river near you is too high or too lowAlert
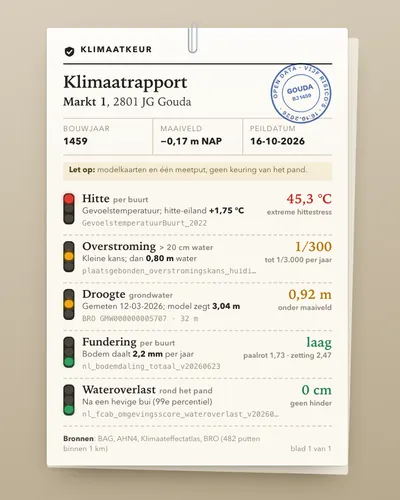 Climate risk check for an addressTool
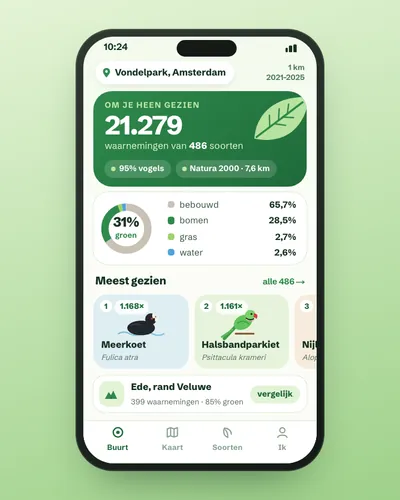 Nature in your neighbourhood: which species were seen and how green is it?App
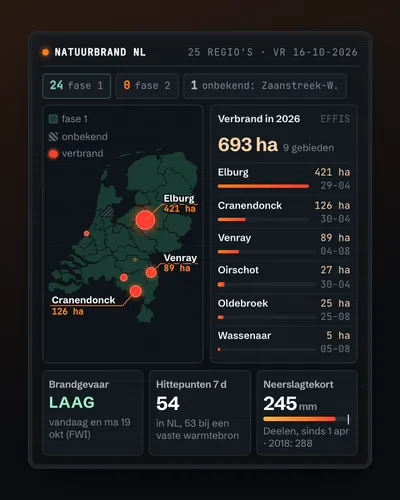 Wildfire map: today's risk, hotspots and burnt landMap
 The Netherlands next to Europe: a comparison tool for any indicatorTool
 Weather app for your own place: warmer, wetter or sunnier than normal?App