Alert when the river near you is too high or too low
A small script that fetches the Rijkswaterstaat water level every few hours, adds the forecast for the coming days and sends an alert when the river leaves the normal band of the past ten years. With KNMI rainfall as context.
geef_project("waterstand-alert")geef_bron("rws-waterinfo")geef_bron("knmi-daggegevens")
I have the project, the tested calls and the pitfalls. I'll build a alert with Waterinfo and Water Web Services and KNMI daily weather data. This is how it could look:
You build this yourself. Copy the prompt into Claude, ChatGPT or Cursor, with the MCP server on, or follow the steps below.
Lower than the lowest point of 2016 to 2025 (647 cm). Forecast for 18 Oct: 625 cm.
- 24 hours earlier
- 632 cm
- Range, 48 hours
- 628-634 cm
- Forecast 18 Oct 06:00
- 625 cm
- Rain at Deelen, 30 days
- 45.1 mm
- Normal (1991-2020)
- 73.1 mm
This is a mockup, not a working version, with the figures from our test run on 16 October 2026, 22:20. Turn the MCP server on with the address on For AI.
Who it's for
People living in floodplains and riverside villages, skippers and inland shipping firms (low water means less cargo), canoeists, local media and anyone who wants a Telegram or Slack bot that says: "The Rhine at Lobith is lower than at any time in the past ten years."
What you get
An alert script for the Rhine at Lobith (where the Rhine enters the Netherlands) that you run every few hours with cron or a GitHub Action. It fetches the last 48 hours of ten-minute values, the Rijkswaterstaat forecast and KNMI rainfall, and returns OK, WATCH or ALERT.
Test run on 16 October 2026, 22:20 (+01:00): the Rhine stood at 630 cm above NAP at Lobith, 2 cm lower than 24 hours earlier. The forecast ran to 18 October 06:00 and dropped to 625 cm. That is lower than the lowest point in all 526,029 ten-minute values from 2016 to 2025 (647 cm on 18 August 2022; in the dry autumn of 2018 the lowest point was 649 cm). On 1 October 2026 at 13:00 the Rhine even stood at 602 cm, with a discharge of 536 m³/s on 30 September (the October 2018 low was 656 m³/s). KNMI station Deelen recorded 45.1 mm of rain from 15 September to 14 October 2026, 62% of the normal for those days in 1991-2020.
Rhine discharge at Lobith (monthly mean): 683 cubic metres per second in September 2026, 61% less than in September 2025
Rhine discharge at Lobith (monthly mean), September 2025 – September 2026, in cubic metres per second. The highest point was February 2026 (3,269). Figures marked * are provisional.
How you could start7 steps
- 1
Find your gauge in the catalogue
Everything is a POST with a JSON body to the new Water Web Services (DDAPI 2.0); the old address waterwebservices.rijkswaterstaat.nl no longer works. The catalogue (1.75 MB, under a second) lists 2,499 locations with code, name and latitude and longitude (ETRS89), and in AquoMetadataLocatieLijst which quantity is measured where. For an alert you want WATHTE (water level in cm relative to NAP, the Dutch datum). Not every location has everything: Lobith Tolkamer and Arnhem Nederrijn have WATHTE and Q (discharge), Nijmegen Waal and Deventer only WATHTE, for the Meuse Sint Pieter and Venlo are good choices. Pick the nearest location that actually has the quantity.
curl -X POST "https://ddapi20-waterwebservices.rijkswaterstaat.nl/METADATASERVICES/OphalenCatalogus" \
  -H 'Content-Type: application/json' -d '{"CatalogusFilter":{"Grootheden":true,"Eenheden":true,"Compartimenten":true}}'
{"Succesvol": true, "AquoMetadataLijst": [...202...], "AquoMetadataLocatieLijst": [...], "LocatieLijst": [...2499...], ...} {"Locatie_MessageID": 15596, "Code": "lobith.bovenrijn.tolkamer", "Coordinatenstelsel": "ETRS89", "Lat": 51.8495, "Lon": 6.1024, "Naam": "Lobith, Bovenrijn, Tolkamer", "Omschrijving": "Lobith, Bovenrijn, Tolkamer"} lobith.bovenrijn.tolkamer ['Q/m3/s', 'T/oC', 'WATHTE/cm'] nijmegen.waal ['WATHTE/cm'] maastricht.sintpieter ['Q/m3/s', 'WATHTE/cm'] - 2
Request the latest measurement
OphalenLaatsteWaarnemingen returns the last value per series, including series that stopped long ago: for Lobith twelve WATHTE series came back, with last values from 1934, 1947, 1987 and 2010. Keep only ProcesType meting and take the value with the newest Tijdstip. Recent values are Ongecontroleerd (unchecked). Times are always in fixed +01:00, also in summer.
curl -X POST "https://ddapi20-waterwebservices.rijkswaterstaat.nl/ONLINEWAARNEMINGENSERVICES/OphalenLaatsteWaarnemingen" \
  -H 'Content-Type: application/json' -d '{"LocatieLijst":[{"Code":"lobith.bovenrijn.tolkamer"}],"AquoPlusWaarnemingMetadataLijst":[{"AquoMetadata":{"Compartiment":{"Code":"OW"},"Grootheid":{"Code":"WATHTE"}}}]}'
{"Succesvol":true,"WaarnemingenLijst":[{"AquoMetadata":{ ... "Grootheid":{"Code":"WATHTE","Omschrijving":"Waterhoogte"}, "Hoedanigheid":{"Code":"NAP","Omschrijving":"t.o.v. Normaal Amsterdams Peil"}, ... "ProcesType":"meting", ...}, "MetingenLijst":[{"Meetwaarde":{"Waarde_Alfanumeriek":"630","Waarde_Numeriek":630.0}, "Tijdstip":"2026-10-16T22:20:00.000+01:00", "WaarnemingMetadata":{"Bemonsteringshoogte":"0","Kwaliteitswaardecode":"00","OpdrachtgevendeInstantie":"RIKZMON_WAT", "Referentievlak":"NVT","Statuswaarde":"Ongecontroleerd"}}]}, ... (en elf oude reeksen, bijvoorbeeld:) {"Meetwaarde":{"Waarde_Alfanumeriek":"1016","Waarde_Numeriek":1016.0},"Tijdstip":"1934-12-31T08:40:00.000+01:00", ... "Statuswaarde":"Definitief"} - 3
Fetch the last 48 hours
OphalenWaarnemingen with ProcesType meting and a period in +01:00 returns the ten-minute values (each value is the mean over five minutes before and after). Without ProcesType you also get the forecast. A time without a time zone (2026-10-16T00:00:00 or just 2026-10-16) gives HTTP 400 with plain text: 'Het parsen van 'Begindatumtijd' is mislukt. Lever geldige waarden aan in het formaat 'yyyy-MM-dd'T'HH:mm:ss+01:00''. Z and +02:00 are converted correctly, but the response is always in +01:00. From 48 hours you get the trend: how many cm per day is the river rising or falling?
curl -X POST "https://ddapi20-waterwebservices.rijkswaterstaat.nl/ONLINEWAARNEMINGENSERVICES/OphalenWaarnemingen" \
  -H 'Content-Type: application/json' -d '{"Locatie":{"Code":"lobith.bovenrijn.tolkamer"},"AquoPlusWaarnemingMetadata":{"AquoMetadata":{"Compartiment":{"Code":"OW"},"Grootheid":{"Code":"WATHTE"},"ProcesType":"meting"}},"Periode":{"Begindatumtijd":"2026-10-15T00:00:00.000+01:00","Einddatumtijd":"2026-10-17T00:00:00.000+01:00"}}'
1 reeks, 279 waarden, 81 kB "WaardeBepalingsMethode": {"Code": "other:F007", "Omschrijving": "Rekenkundig gemiddelde waarde over vorige 5 en volgende 5 minuten"} 2026-10-15T00:00:00.000+01:00 630.0 Ongecontroleerd 2026-10-15T00:10:00.000+01:00 628.0 Ongecontroleerd ... 2026-10-16T22:10:00.000+01:00 630.0 Ongecontroleerd 2026-10-16T22:20:00.000+01:00 630.0 Ongecontroleerd - 4
Derive your own thresholds from ten years of data
Rijkswaterstaat has official warning levels, but they are not in the API and the pages of waterinfo.rws.nl outside /publiek and /thema are closed in robots.txt. So: fetch ten years of ten-minute values (one call per year, 15 MB and 3.5 seconds; more than a year at a time makes the response unwieldy) and compute percentiles. For Lobith 2016 to 2025: 526,029 values, lowest 647 cm (18 August 2022), lowest 5% below 717 cm, median 877 cm, highest 5% above 1,207 cm, highest 1% above 1,349 cm, highest 1,464 cm (10 January 2018). Do this once and put the numbers in your script. Note: in 2025 two series came back that overlap for a month (sensor change on 28 October 2025, 4,279 identical values): deduplicate on timestamp.
curl -X POST "https://ddapi20-waterwebservices.rijkswaterstaat.nl/ONLINEWAARNEMINGENSERVICES/OphalenWaarnemingen" \
  -H 'Content-Type: application/json' -d '{"Locatie":{"Code":"lobith.bovenrijn.tolkamer"},"AquoPlusWaarnemingMetadata":{"AquoMetadata":{"Compartiment":{"Code":"OW"},"Grootheid":{"Code":"WATHTE"},"ProcesType":"meting"}},"Periode":{"Begindatumtijd":"2018-01-01T00:00:00.000+01:00","Einddatumtijd":"2019-01-01T00:00:00.000+01:00"}}'
2016 200 15.0 MB 3.6 s [('SB', 52705)] 2018 200 15.0 MB 3.6 s [('SB', 52561)] 2022 200 15.0 MB 3.4 s [('SB', 52561)] 2025 200 16.0 MB 4.9 s [('SB', 9310), ('SB', 47526)] percentiel 0: 647 1: 665 5: 717 10: 744 50: 877 90: 1110 95: 1207 99: 1349 100: 1464 2018 (649.0, '2018-10-23T08:30:00.000+01:00') (1464.0, '2018-01-10T07:20:00.000+01:00') 2022 (647.0, '2022-08-18T03:50:00.000+01:00') (1282.0, '2022-01-08T10:50:00.000+01:00') 2026 tot nu: min 2026-10-01T13:00:00.000+01:00 602.0 max 2026-02-26T13:00:00.000+01:00 1297.0 - 5
Add the forecast
With ProcesType verwachting you get the Rijkswaterstaat water level forecast (method RWSM-F232). On 16 October 2026 it ran to 18 October 06:00, about a day and a half ahead, with 325 values from midnight. An alert on the forecast warns earlier than an alert on the measurement. Feel free to ask for a longer period; you get back what exists.
curl -X POST "https://ddapi20-waterwebservices.rijkswaterstaat.nl/ONLINEWAARNEMINGENSERVICES/OphalenWaarnemingen" \
  -H 'Content-Type: application/json' -d '{"Locatie":{"Code":"lobith.bovenrijn.tolkamer"},"AquoPlusWaarnemingMetadata":{"AquoMetadata":{"Compartiment":{"Code":"OW"},"Grootheid":{"Code":"WATHTE"},"ProcesType":"verwachting"}},"Periode":{"Begindatumtijd":"2026-10-16T00:00:00.000+01:00","Einddatumtijd":"2026-10-22T00:00:00.000+01:00"}}'
verwachting {'Code': 'RWSM-F232', 'Omschrijving': 'RWS Methodiek F232'} 325 waarden 2026-10-16T00:00:00.000+01:00 630.0 ... 2026-10-18T06:00:00.000+01:00 625.0 {"Meetwaarde": {"Waarde_Alfanumeriek": "625", "Waarde_Numeriek": 625.0}, "Tijdstip": "2026-10-18T06:00:00.000+01:00", "WaarnemingMetadata": {"Bemonsteringshoogte": "0", ... "Statuswaarde": "Ongecontroleerd"}} - 6
Discharge (Q): pick the right series
Discharge in m³/s says more than water level when you compare years (the riverbed changes), but Q is a computed quantity and that shows in the data. For October 2018 three Q series came back: 'Debiet uit Q-f relatie' (old formula), 'Debiet uit Q-f relatie (2018)' (checked) and a daily mean (WaardeBewerkingsMethode GEM24H); one of the series also had values of 9.99999e+37 (no value). In 2026 there are two SB series with identical metadata (one up to 23 August, one from 26 August) and a separate one-day NVT series (1 January) with 237 to 243 m³/s, while the SB series gave 1,136 to 1,185 m³/s that day, with exactly the same computation rule. So pick the series with WaardeBepalingsMethode 'Debiet uit Q-f relatie (2018)' and WaardeBewerkingsMethode NVT, take the one with BemonsteringsSoort SB if it exists (before 2025 only NVT exists), and filter out impossible values.
curl -X POST "https://ddapi20-waterwebservices.rijkswaterstaat.nl/ONLINEWAARNEMINGENSERVICES/OphalenWaarnemingen" \
  -H 'Content-Type: application/json' -d '{"Locatie":{"Code":"lobith.bovenrijn.tolkamer"},"AquoPlusWaarnemingMetadata":{"AquoMetadata":{"Compartiment":{"Code":"OW"},"Grootheid":{"Code":"Q"},"ProcesType":"meting"}},"Periode":{"Begindatumtijd":"2018-10-24T00:00:00.000+01:00","Einddatumtijd":"2018-10-25T00:00:00.000+01:00"}}'
{'Code': 'other:F216', 'Omschrijving': 'Debiet uit Q-f relatie'} NVT 145 [('00:00', 741.6, 'Ongecontroleerd'), ...] {'Code': 'other:F216', 'Omschrijving': 'Debiet uit Q-f relatie'} GEM24H 2 [('00:00', 735.0, 'Ongecontroleerd'), ...] {'Code': 'other:F230', 'Omschrijving': 'Debiet uit Q-f relatie (2018)'} NVT 145 [('00:00', 683.58, 'Gecontroleerd'), ...] september-oktober 2026, Q-f relatie (2018): laagste 536.22 m³/s op 2026-09-30T08:10:00.000+01:00 - 7
Rainfall as context
KNMI daily data gives the daily rainfall per station (RH, in tenths of a mm; -1 means less than 0.05 mm) and evaporation (EV24, tenths of a mm). Station 275 Deelen is near Arnhem. Sum the last 30 days and compare with the same calendar days in 1991-2020. Do say that the Rhine at Lobith mainly responds to rain and snowmelt in Germany and Switzerland, with days of delay; for small rivers and streams local rain is the explanation. The daily data lags one or two days: on 16 October, 14 October was the newest day.
curl -X POST "https://www.daggegevens.knmi.nl/klimatologie/daggegevens" \
  -d 'stns=275&vars=RH:EV24&start=20261010&end=20261016&fmt=json'
[{"station_code":275,"date":"2026-10-10T00:00:00.000Z","RH":21,"EV24":13},
 {"station_code":275,"date":"2026-10-11T00:00:00.000Z","RH":75,"EV24":9},
 {"station_code":275,"date":"2026-10-12T00:00:00.000Z","RH":0,"EV24":17},
 {"station_code":275,"date":"2026-10-13T00:00:00.000Z","RH":45,"EV24":5},
 {"station_code":275,"date":"2026-10-14T00:00:00.000Z","RH":0,"EV24":16}]
How the sources fit together
- Waterinfo and Water Web ServicesKNMI daily weather datavia
datum (dagwaarde) en plaats: kies het KNMI-station dichtbij het meetpunt (Lobith en Arnhem: 275 Deelen; Maastricht: 380)Put the daily lowest or highest water level next to the rainfall of the days before. For streams and small rivers you see the link straight away; for the Rhine and the Meuse most water comes from abroad and the KNMI station is only a local hint.
- Waterinfo and Water Web ServicesActueel Hoogtebestand Nederland (AHN, national elevation model)via
hoogte ten opzichte van NAP (Waterinfo in cm, AHN in m)Put the forecast water level next to the height of a floodplain or quay from the AHN: which land lies below the river? A first estimate, because the slope of the river (it drops downstream) and dikes are not taken into account.
Let AI build it
Paste this prompt into Claude, ChatGPT, Cursor or Lovable. It names the real endpoints, the join keys and the pitfalls, so the assistant writes working code straight away. Always check the result against the source itself.
Build a water level alert for a Dutch river. The script runs every three hours (cron or GitHub Actions), fetches the water level from Rijkswaterstaat and sends a message (Telegram, Slack or email) when the river leaves its normal band. No key needed.

Data: Rijkswaterstaat Water Web Services, DDAPI 2.0. Everything is POST with a JSON body to https://ddapi20-waterwebservices.rijkswaterstaat.nl/. Do NOT use the old address waterwebservices.rijkswaterstaat.nl (redirects to a migration page) and NOT the internal API of waterinfo.rws.nl (robots.txt forbids everything except /publiek and /thema).
- Locations: POST METADATASERVICES/OphalenCatalogus with {"CatalogusFilter":{"Grootheden":true,"Eenheden":true,"Compartimenten":true}}. 2,499 locations with Code, Naam, Lat, Lon (ETRS89). AquoMetadataLocatieLijst links Locatie_MessageID to AquoMetaData_MessageID: that tells you which quantity (WATHTE water level in cm relative to NAP, Q discharge in m³/s) exists at which location. Good gauges: lobith.bovenrijn.tolkamer (Rhine), nijmegen.waal, arnhem.nederrijn, deventer (IJssel), maastricht.sintpieter and venlo (Meuse).
- Measurement: POST ONLINEWAARNEMINGENSERVICES/OphalenWaarnemingen with {"Locatie":{"Code":"lobith.bovenrijn.tolkamer"},"AquoPlusWaarnemingMetadata":{"AquoMetadata":{"Compartiment":{"Code":"OW"},"Grootheid":{"Code":"WATHTE"},"ProcesType":"meting"}},"Periode":{"Begindatumtijd":"2026-10-15T00:00:00.000+01:00","Einddatumtijd":"2026-10-17T00:00:00.000+01:00"}}. Values in WaarnemingenLijst[].MetingenLijst[] with Tijdstip, Meetwaarde.Waarde_Numeriek and WaarnemingMetadata.Statuswaarde.
- Forecast: the same call with "ProcesType":"verwachting" (runs about a day and a half ahead).

Pitfalls you MUST handle:
- Always give times with a time zone, preferably the way the API returns them: 2026-10-16T22:20:00.000+01:00 (fixed +01:00, also in summer). Without a time zone you get HTTP 400 with plain text ('Het parsen van 'Begindatumtijd' is mislukt'), so do not blindly call .json(). The response is always in +01:00; show times to users in Dutch local time (summer time = one hour later).
- Without ProcesType you get measurement, forecast and astronomical tide mixed together.
- OphalenLaatsteWaarnemingen also returns old, stopped series (Lobith: last values from 1934, 1947, 2010). Take the measurement with the newest Tijdstip.
- Several series can come back at once (sensor change); deduplicate on Tijdstip.
- Values like 999999999 or 9.99999e+37 mean 'no value': filter everything outside a sensible band.
- Recent values are 'Ongecontroleerd' (unchecked); say so in the message.
- Q (discharge) is computed. Several series sit side by side (old Q-f relation, Q-f relation (2018), daily mean GEM24H). Pick WaardeBepalingsMethode 'Debiet uit Q-f relatie (2018)', WaardeBewerkingsMethode NVT and, if present, BemonsteringsSoort SB (on 1 January 2026 an NVT series with the same rule gave 237 m³/s against 1,150 in the SB series).
- Official warning levels are not in the API. Compute percentiles once from ten years of ten-minute values (one call per year, about 15 MB) and store them. Lobith 2016-2025: lowest 647 cm, P5 717, median 877, P95 1207, P99 1349, highest 1464 cm above NAP.
- Do not poll every ten minutes: values arrive every ten minutes, an alert every one to three hours is enough. Send an honest User-Agent.

Rainfall as context: KNMI daily data, POST https://www.daggegevens.knmi.nl/klimatologie/daggegevens with stns=275&vars=RH&start=YYYYMMDD&end=YYYYMMDD&fmt=json. RH in tenths of a mm, -1 is less than 0.05 mm (count as 0). The newest day is usually the day before yesterday. Say in the message that the Rhine is mainly fed by rain in Germany and Switzerland.

Output: a message like "The Rhine at Lobith stands at 630 cm above NAP (16 October 22:20), 2 cm lower than yesterday. That is below the lowest point of 2016-2025 (647 cm). Forecast for 18 October: 625 cm.", sent only when the status changes (OK to WATCH, WATCH to ALERT and back), plus a small web page with a chart of the last 30 days and the thresholds as horizontal lines.
Try it yourself
The core of the project in a small script. Needs: Python 3.10+ en requests. Tested on 2026-10-16; below is the real output of that run.
# Waterstand-alert: staat de Rijn bij Lobith te hoog of te laag? Plus de neerslag van de afgelopen 30 dagen.
# Bronnen: Rijkswaterstaat Waterwebservices (DDAPI 2.0) en KNMI daggegevens. Geen sleutel nodig.
from datetime import datetime, timedelta, timezone
import requests

UA = {"User-Agent": "mijn-project/1.0 (+jij@voorbeeld.nl)"}
RWS = "https://ddapi20-waterwebservices.rijkswaterstaat.nl/ONLINEWAARNEMINGENSERVICES"
LOCATIE, NAAM = "lobith.bovenrijn.tolkamer", "Rijn bij Lobith"
# Drempels in cm boven NAP, berekend uit alle tienminutenwaarden 2016-2025 (526.029 waarden, zie stap 4).
DREMPELS = {"zeer laag": 647, "laag": 717, "hoog": 1207, "zeer hoog": 1349}
WT = timezone(timedelta(hours=1))   # de API werkt in vaste +01:00, ook in de zomer

def t(d):   # 2026-10-16T22:20:00.000+01:00
    return d.astimezone(WT).strftime("%Y-%m-%dT%H:%M:%S.000+01:00")

def waarnemingen(proces, begin, eind):
    body = {"Locatie": {"Code": LOCATIE},
            "AquoPlusWaarnemingMetadata": {"AquoMetadata": {"Compartiment": {"Code": "OW"},
                                           "Grootheid": {"Code": "WATHTE"}, "ProcesType": proces}},
            "Periode": {"Begindatumtijd": t(begin), "Einddatumtijd": t(eind)}}
    d = requests.post(f"{RWS}/OphalenWaarnemingen", json=body, headers=UA, timeout=120).json()
    if not d.get("Succesvol"):
        return {}
    uit = {}   # tijdstip -> cm; dubbele reeksen (bij een sensorwissel) vallen zo samen
    for w in d["WaarnemingenLijst"]:
        for m in w["MetingenLijst"]:
            v = m["Meetwaarde"]["Waarde_Numeriek"]
            if v is not None and -999 < v < 5000:   # 999999999 en 9.99999e+37 zijn 'geen waarde'
                uit[datetime.fromisoformat(m["Tijdstip"])] = v
    return dict(sorted(uit.items()))

def oordeel(cm):
    if cm <= DREMPELS["zeer laag"]: return "ALERT: lager dan het laagste punt van 2016-2025"
    if cm <= DREMPELS["laag"]:      return "LET OP: laagwater (laagste 5% van 2016-2025)"
    if cm >= DREMPELS["zeer hoog"]: return "ALERT: hoogwater (hoogste 1% van 2016-2025)"
    if cm >= DREMPELS["hoog"]:      return "LET OP: hoog (hoogste 5% van 2016-2025)"
    return "OK: binnen de normale band"

nu = datetime.now(timezone.utc)
gemeten = waarnemingen("meting", nu - timedelta(hours=48), nu)
laatste_t, laatste = list(gemeten.items())[-1]
dag_eerder = min(gemeten, key=lambda x: abs((laatste_t - x) - timedelta(hours=24)))
verwacht = waarnemingen("verwachting", nu, nu + timedelta(days=4))

print(f"{NAAM}: {laatste:.0f} cm boven NAP om {laatste_t:%d-%m-%Y %H:%M} (+01:00), ongecontroleerd")
print(f"  24 uur eerder: {gemeten[dag_eerder]:.0f} cm, verschil {laatste - gemeten[dag_eerder]:+.0f} cm")
print(f"  laagste en hoogste in 48 uur: {min(gemeten.values()):.0f} en {max(gemeten.values()):.0f} cm")
if verwacht:
    vt, vw = list(verwacht.items())[-1]
    print(f"  verwachting tot {vt:%d-%m %H:%M}: {min(verwacht.values()):.0f} tot {max(verwacht.values()):.0f} cm, eind {vw:.0f} cm")
print(f"  nu: {oordeel(laatste)}")
if verwacht:
    print(f"  eind verwachting: {oordeel(vw)}")

# Neerslag in het eigen land: KNMI-station 275 (Deelen, bij Arnhem), laatste 30 dagen tegen 1991-2020.
def rh(start, eind):
    r = requests.post("https://www.daggegevens.knmi.nl/klimatologie/daggegevens", headers=UA, timeout=120,
                      data={"stns": "275", "vars": "RH", "start": start, "end": eind, "fmt": "json"})
    return [(d["date"][:10], max(d["RH"], 0) / 10) for d in r.json() if d["RH"] is not None]   # tienden mm, -1 = < 0,05 mm

recent = rh(f"{(nu - timedelta(days=40)):%Y%m%d}", f"{nu:%Y%m%d}")[-30:]
som = sum(v for _, v in recent)
dagen = {d[5:] for d, _ in recent}           # dezelfde kalenderdagen in 1991-2020
normaal = rh("19910101", "20201231")
per_jaar = {}
for d, v in normaal:
    if d[5:] in dagen:
        per_jaar[d[:4]] = per_jaar.get(d[:4], 0) + v
gem = sum(per_jaar.values()) / len(per_jaar)
print(f"\nNeerslag Deelen {recent[0][0]} t/m {recent[-1][0]}: {som:.1f} mm, normaal (1991-2020) {gem:.1f} mm ({som / gem:.0%})")
print("Let op: de Rijn bij Lobith hangt vooral af van regen en smeltwater in Duitsland en Zwitserland.")
Rijn bij Lobith: 630 cm boven NAP om 16-10-2026 22:20 (+01:00), ongecontroleerd
  24 uur eerder: 632 cm, verschil -2 cm
  laagste en hoogste in 48 uur: 628 en 634 cm
  verwachting tot 18-10 06:00: 625 tot 627 cm, eind 625 cm
  nu: ALERT: lager dan het laagste punt van 2016-2025
  eind verwachting: ALERT: lager dan het laagste punt van 2016-2025

Neerslag Deelen 2026-09-15 t/m 2026-10-14: 45.1 mm, normaal (1991-2020) 73.1 mm (62%)
Let op: de Rijn bij Lobith hangt vooral af van regen en smeltwater in Duitsland en Zwitserland.
Where it goes wrong
- Times in the response are always in fixed +01:00, also in summer: 22:20 in the data is 23:20 on the clock in July. Always send a time zone in the request (2026-10-16T22:20:00.000+01:00); without one you get HTTP 400 with an error in plain text instead of JSON.
- The 'latest observation' is not always the newest: OphalenLaatsteWaarnemingen returned twelve WATHTE series for Lobith, eleven of which had stopped (1934 to 2025). Take the first and you report a level of 1,016 cm from 1934. Sort by Tijdstip.
- Discharge (Q) has several parallel series with different computation rules, single days with odd values (237 m³/s on 1 January 2026, while the continuous series was around 1,150) and 9.99999e+37 as 'no value'. Use the water level (WATHTE, one continuous series) for an alert and, for discharge, only the series 'Debiet uit Q-f relatie (2018)', preferably BemonsteringsSoort SB.
- Water level is not discharge and differs by location. 630 cm above NAP is extremely low at Lobith but says nothing about Nijmegen or Deventer. Compute thresholds per gauge, and for long comparisons prefer discharge: the Rhine bed has dropped over recent decades, so the same discharge now gives a lower water level.
- Our thresholds are statistical (percentiles over 2016-2025), not official warning levels. Call them that in your message, and refer to Rijkswaterstaat and your water board for official warnings.
- Large responses: one year of ten-minute values is 15 MB, because every value carries its full metadata. For an alert, request only the last 48 hours (81 kB) and store your thresholds instead of recomputing them every time.
Take it further
- More gauges: the same calls work for the Meuse (maastricht.sintpieter, venlo), the Waal (nijmegen.waal), the IJssel (deventer) and the Nederrijn (arnhem.nederrijn). Let users click on a map and pick the nearest location with WATHTE from the catalogue.
- Low water and shipping: skippers think in draught. Express the level as 'this many cm below the median' and show how many days per year Lobith was below the 5% threshold (717 cm); 2018 and 2022 make a good comparison with 2026.
- Sea level and storms: for Hoek van Holland or Vlissingen, ProcesType astronomisch gives the tide without wind. The difference with the measurement is the storm surge; link it to the wind (FHX, DDVEC) from the coastal KNMI station.
- Look upstream: the German PEGELONLINE has Emmerich, just above Lobith. A rise there shows up at Lobith shortly afterwards; measure for yourself how many hours lie in between.
The sources2

Waterinfo and Water Web Services
Rijkswaterstaat's measurements in the major rivers, along the coast and in the North Sea: water level, discharge, water temperature, waves and more. A new value every ten minutes, and for some stations a series going back to 1900. Waterinfo is the website, the Water Web Services are the API behind it.
KNMI daily weather dataIn depth
Daily values from over fifty weather stations: temperature, rainfall, sunshine and wind. The De Bilt series starts in 1901.
More to build
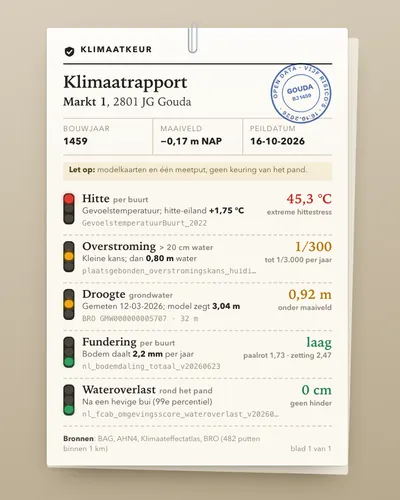 Climate risk check for an addressTool
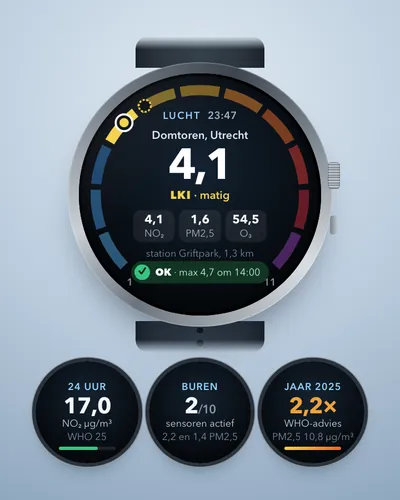 Air quality alert for your own streetAlert
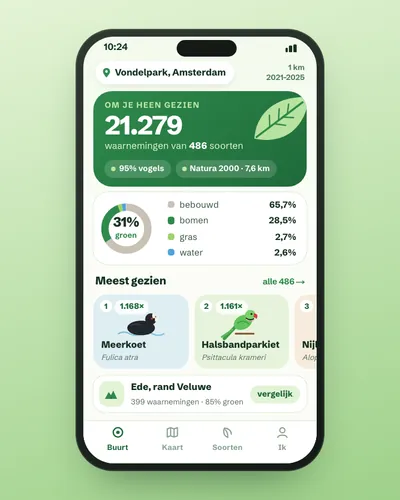 Nature in your neighbourhood: which species were seen and how green is it?App
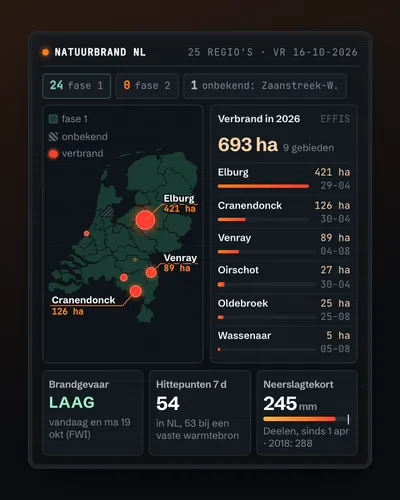 Wildfire map: today's risk, hotspots and burnt landMap
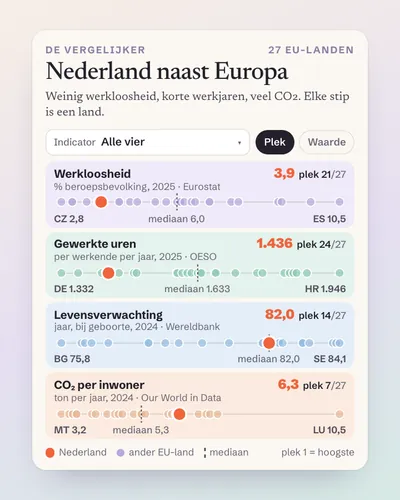 The Netherlands next to Europe: a comparison tool for any indicatorTool
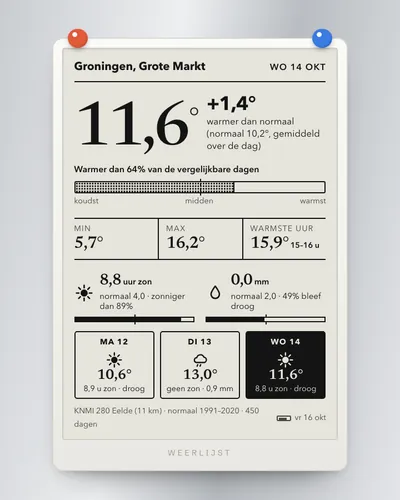 Weather app for your own place: warmer, wetter or sunnier than normal?App