The Netherlands next to Europe: a comparison tool for any indicator
Pick a figure (unemployment, hours worked, life expectancy, CO2) and see at once where the Netherlands ranks among the 27 EU countries, with four international sources behind one button.
geef_project("nederland-naast-europa")geef_bron("eurostat")geef_bron("oecd-data")geef_bron("worldbank")
I have the project, the tested calls and the pitfalls. I'll build a tool with Eurostat, OECD Data Explorer, World Bank indicators and Our World in Data. This is how it could look:
You build this yourself. Copy the prompt into Claude, ChatGPT or Cursor, with the MCP server on, or follow the steps below.
Netherlands vs the EU
Low unemployment, short working years, a lot of CO₂. Each dot is a country.
This is a mockup, not a working version, with the values for all 27 EU countries, fetched on 17 October 2026 from Eurostat, the OECD, the World Bank and Our World in Data with the calls from the steps (for the Netherlands the same as our test run on 16 October). Turn the MCP server on with the address on For AI.
Who it's for
Journalists and fact-checkers who want to check a claim like 'the Dutch work the least in Europe', teachers, students and political parties.
What you get
A page with a drop-down of indicators. Each choice shows a sorted bar chart of the 27 EU countries with the Netherlands in orange, the Dutch rank and the median. The test run on 16 October 2026 gave: unemployment 2025 (Eurostat) Netherlands 3.9%, rank 21 of 27 (1 = highest), median 6.0%, Spain highest at 10.5%. Hours worked per worker in 2025 (OECD) 1,436 hours, rank 24 of 27; only in Germany (1,332) were fewer hours worked, the most in Croatia (1,946). Life expectancy 2024 (World Bank) 82.0 years, rank 14 of 27, exactly the median; Sweden 84.1, Bulgaria 75.8. CO2 emissions per person 2024 (Our World in Data) 6.3 tonnes, rank 7 of 27, median 5.3; Luxembourg 10.5 tonnes. Each source has its own country codes and format; the project converts them into one shape (country, year, value).
Unemployment in the Netherlands: lower than in 20 of the 26 other EU countries
Unemployment in 2025, in percent of the labour force (15–74). Netherlands: 3.9; EU average: 6.0. Highest: Spain (10.5); lowest: Czechia (2.8).
How you could start6 steps
- 1
Eurostat: unemployment in JSON-stat
Eurostat uses two-letter codes, with two exceptions: Greece is EL (not GR) and the EU average is called EU27_2020. All values are in one flat object 'value'; the position follows from the order in 'id' and the sizes in 'size'. Missing cells are left out. Ask for every dimension explicitly (age, sex, unit), or you get all combinations mixed together. Without geo= you also get groups (EA20, EA21) and non-EU countries (IS, NO, CH, TR): filter on the 27 yourself.
https://ec.europa.eu/eurostat/api/dissemination/statistics/1.0/data/une_rt_a?age=Y15-74&sex=T&unit=PC_ACT&geo=NL&geo=EL&geo=EU27_2020&lastTimePeriod=1&format=JSON
{"label":"Unemployment by sex and age - annual data","updated":"2026-09-10T23:00:00+0200", "id":["freq","age","unit","sex","geo","time"],"size":[1,1,1,1,3,1], "value":{"0":6,"1":8.9,"2":3.9}, "dimension":{"geo":{"category":{"index":{"EU27_2020":0,"EL":1,"NL":2}}},"time":{"category":{"index":{"2025":0}}}, …}} - 2
OECD: hours worked through SDMX
The OECD uses three-letter codes (NLD, DEU, GRC). The key has 13 positions separated by dots; empty = all. Put _T in position 9 (WORKER_STATUS), or you also get the hours of employees only (over 80 hours a year difference for the Netherlands). All 27 EU countries are in this table, including non-OECD members (Bulgaria, Croatia, Cyprus, Malta, Romania). Watch out in Node: fetch sends 'Accept-Language: *' and the API then answers with HTTP 500. Set 'Accept-Language: en'. curl does not have this problem. Rows come unsorted.
https://sdmx.oecd.org/public/rest/data/OECD.ELS.SAE,DSD_HW@DF_AVG_ANN_HRS_WKD,1.0/NLD+DEU+BEL+GRC........_T....?startPeriod=2025&format=csvfile
DATAFLOW,REF_AREA,MEASURE,UNIT_MEASURE,SEX,AGE,LABOUR_FORCE_STATUS,WORK_PERIOD,HOURS_TYPE,WORKER_STATUS,WORK_TIME_ARNGMNT,AGGREGATION_OPERATION,HOUR_BANDS,JOB_COVERAGE,TIME_PERIOD,OBS_VALUE,OBS_STATUS,UNIT_MULT,DECIMALS
OECD.ELS.SAE:DSD_HW@DF_AVG_ANN_HRS_WKD(1.0),BEL,HW,H_Y_PS,_Z,_Z,EMP,A,ACTUAL,_T,_Z,MEAN,_Z,_T,2025,1586,A,,0
OECD.ELS.SAE:DSD_HW@DF_AVG_ANN_HRS_WKD(1.0),DEU,HW,H_Y_PS,_Z,_Z,EMP,A,ACTUAL,_T,_Z,MEAN,_Z,_T,2025,1332.2,A,,0
OECD.ELS.SAE:DSD_HW@DF_AVG_ANN_HRS_WKD(1.0),GRC,HW,H_Y_PS,_Z,_Z,EMP,A,ACTUAL,_T,_Z,MEAN,_Z,_T,2025,1874.319,A,,0
OECD.ELS.SAE:DSD_HW@DF_AVG_ANN_HRS_WKD(1.0),NLD,HW,H_Y_PS,_Z,_Z,EMP,A,ACTUAL,_T,_Z,MEAN,_Z,_T,2025,1436.037,A,,0
- 3
World Bank: life expectancy, with empty years
Countries separated by semicolons, always with format=json and date=. The response is a list of two parts: first paging (total, lastupdated), then the rows. The newest year often exists already, but with value null: 2025 had no life expectancy yet on 16 October 2026. For each indicator pick the last year in which the Netherlands and at least 24 EU countries have a value. The country code is in countryiso3code (GRC for Greece); the EU average is EUU.
https://api.worldbank.org/v2/country/NLD;DEU;GRC/indicator/SP.DYN.LE00.IN?format=json&date=2024:2025
[{"page":1,"pages":1,"per_page":50,"total":6,"sourceid":"2","lastupdated":"2026-10-08"}, [{"indicator":{"id":"SP.DYN.LE00.IN","value":"Life expectancy at birth, total (years)"},"country":{"id":"DE","value":"Germany"},"countryiso3code":"DEU","date":"2025","value":null,…}, {…,"countryiso3code":"DEU","date":"2024","value":80.7926829268293,…}, {…,"countryiso3code":"GRC","date":"2025","value":null,…}, {…,"countryiso3code":"GRC","date":"2024","value":81.8390243902439,…}, {…,"countryiso3code":"NLD","date":"2025","value":null,…}, {…,"countryiso3code":"NLD","date":"2024","value":81.9658536585366,…}]] - 4
Our World in Data: CO2 per person as CSV
Every OWID chart is also a CSV: add .csv to the name. Separate countries with ~ (three-letter codes); the EU average is OWID_EU27. useColumnShortNames=true gives short column names. The CSV is sorted by country name, not by code. Unit, source and next update are in .metadata.json (for this chart: Global Carbon Budget 2025, lastUpdated 2025-11-13, nextUpdate 2026-11-13, 'with major processing by Our World in Data').
https://ourworldindata.org/grapher/co-emissions-per-capita.csv?v=1&csvType=filtered&useColumnShortNames=true&country=NLD~DEU~GRC~OWID_EU27&time=2024
entity,code,year,emissions_total_per_capita
European Union (27),OWID_EU27,2024,5.388372
Germany,DEU,2024,6.7688236
Greece,GRC,2024,5.310692
Netherlands,NLD,2024,6.29691
- 5
Find new indicators in the catalogues
Every source has a list to search. World Bank: World Development Indicators (source 2) with 1,498 indicators, with name and explanation (sourceNote). Eurostat: the table of contents (catalogue/toc/txt, 2 MB). OECD: dataflow/all (1,550 tables, 10 MB). OWID: the sitemap with chart names. Store the source, code, fixed filters and unit of each indicator in one configuration file: then a new indicator costs one line.
https://api.worldbank.org/v2/source/2/indicator?format=json&per_page=2
[{"page":1,"pages":749,"per_page":"2","total":1498}, [{"id":"AG.CON.FERT.PT.ZS","name":"Fertilizer consumption (% of fertilizer production)","unit":"","source":{"id":"2","value":"World Development Indicators"}, "sourceNote":"Fertilizer consumption measures the quantity of plant nutrients …"}, …]] - 6
Convert everything to one shape and draw
For each source write a small function that returns rows as { country, year, value } with one kind of country code (for example the Eurostat code, with EL for Greece). Sort, find the Netherlands, compute the rank and the median. Show the year with each indicator: Eurostat and OECD already had 2025, the World Bank and OWID only 2024. Give equal values the same rank, or say they are tied (unemployment: the Netherlands and Slovenia both 3.9%).
How the sources fit together
- EurostatOECD Data Explorervia
landcode (Eurostat NL en EL, OESO NLD en GRC)Both have work and income figures; Eurostat covers all EU countries with regions, the OECD also countries outside Europe (US, Japan). Put both side by side for the same indicator: differences usually come from definitions.
- World Bank indicatorsOur World in Datavia
ISO3-landcode (NLD), EU-gemiddelde EUU en OWID_EU27Many OWID charts use World Bank figures as their source, sometimes with their own processing. Check the producer in the OWID metadata (origins) before presenting both as independent sources.
- EurostatWorld Bank indicatorsvia
landcode, omzetten ISO2 naar ISO3 (EL wordt GRC)Eurostat has the newest European figures, the World Bank long series for every country in the world. Use the World Bank when you also want to compare the Netherlands with the US or China.
Let AI build it
Paste this prompt into Claude, ChatGPT, Cursor or Lovable. It names the real endpoints, the join keys and the pitfalls, so the assistant writes working code straight away. Always check the result against the source itself.
Build a comparison tool (Next.js or one HTML file with JavaScript and D3/Chart.js) where I pick an indicator and see a sorted bar chart of the 27 EU countries with the Netherlands in orange, plus the Dutch rank, the median and the year.

Four sources, none needs a key:
1. Eurostat (JSON-stat): https://ec.europa.eu/eurostat/api/dissemination/statistics/1.0/data/une_rt_a?age=Y15-74&sex=T&unit=PC_ACT&lastTimePeriod=1&format=JSON
2. OECD (SDMX, CSV): https://sdmx.oecd.org/public/rest/data/OECD.ELS.SAE,DSD_HW@DF_AVG_ANN_HRS_WKD,1.0/AUT+BEL+…+SWE........_T....?startPeriod=2024&format=csvfile
3. World Bank (JSON): https://api.worldbank.org/v2/country/AUT;BEL;…;SWE/indicator/SP.DYN.LE00.IN?format=json&date=2020:2026&per_page=500
4. Our World in Data (CSV): https://ourworldindata.org/grapher/co-emissions-per-capita.csv?v=1&csvType=filtered&useColumnShortNames=true&country=AUT~BEL~…~SWE&time=2024

What you need to know:
- Country codes differ: Eurostat two letters with EL for Greece and EU27_2020 for the EU; OECD, World Bank and OWID three letters (GRC). EU average: World Bank EUU, OWID OWID_EU27. Build one mapping table for the 27 countries.
- Eurostat JSON-stat: values in one flat object 'value', position from 'id' and 'size'; missing cells are absent. Choose every dimension explicitly. Without geo= you also get groups and non-EU countries.
- OECD: key with 13 positions separated by dots; _T in position 9 = all workers. No result = HTTP 404 'NoResultsFound', not an empty list. Send 'Accept-Language: en': Node fetch otherwise sends 'Accept-Language: *' and you get HTTP 500. Rows come unsorted. On a 429: wait 15, 30, 45 seconds.
- World Bank: always format=json and date=; the response is [paging, rows]. The newest year can have value null. Pick the last year with a value for the Netherlands and at least 24 EU countries.
- OWID: separate countries with ~; the CSV is sorted by name. Read unit, source and nextUpdate from .metadata.json at the same URL. Third-party figures fall under their own licence; mention 'with major processing by Our World in Data' when the metadata says so.
- Send your own User-Agent with every call ('my-project/1.0 (+you@example.com)'). www.oecd.org refuses scripts (403); the API at sdmx.oecd.org works.
- Keep the indicators in a configuration: { name, source, code, filters, unit, decimals, 'higher is better' yes/no }.

Output: drop-down at the top, a sentence computed from the data ('In 2025 a worker in the Netherlands worked 1,436 hours; only in Germany was it less'), the bar chart with a median line, and at the bottom source, table code, year and fetch date. Show equal values with the same rank.
Try it yourself
The core of the project in a small script. Needs: Node 20+ (fetch zit erin), geen pakketten. Tested on 2026-10-16; below is the real output of that run.
// Nederland naast de EU-landen: één indicator uit vier bronnen, omgezet naar één vorm { land, jaar, waarde }.
// Bronnen: Eurostat (JSON-stat), OESO (SDMX-CSV), Wereldbank (JSON), Our World in Data (CSV). Geen sleutel nodig.
// Draai met: node vergelijker.mjs   (Node 20+)
// Accept-Language is nodig: Node stuurt anders 'Accept-Language: *' en dan geeft de OESO-API een HTTP 500.
const UA = { "User-Agent": "mijn-project/1.0 (+jij@voorbeeld.nl)", "Accept-Language": "en" };

// EU-27 als ISO3 -> ISO2 zoals Eurostat ze schrijft (Griekenland = EL bij Eurostat, GR bij de rest).
const EU = { AUT: "AT", BEL: "BE", BGR: "BG", HRV: "HR", CYP: "CY", CZE: "CZ", DNK: "DK", EST: "EE", FIN: "FI", FRA: "FR",
  DEU: "DE", GRC: "EL", HUN: "HU", IRL: "IE", ITA: "IT", LVA: "LV", LTU: "LT", LUX: "LU", MLT: "MT", NLD: "NL", POL: "PL",
  PRT: "PT", ROU: "RO", SVK: "SK", SVN: "SI", ESP: "ES", SWE: "SE" };
const ISO3 = Object.keys(EU), ISO2 = Object.values(EU);
const haal = async (url, soort = "json") => { const r = await fetch(url, { headers: UA }); if (!r.ok) throw new Error(`${r.status} ${url}`); return soort === "json" ? r.json() : r.text(); };
const csv = (t) => { const [kop, ...r] = t.trim().split("\n").map((l) => l.split(",")); return r.map((x) => Object.fromEntries(kop.map((k, i) => [k, x[i]]))); };

// 1. Eurostat: werkloosheid 15-74 jaar, procent van de beroepsbevolking (une_rt_a). JSON-stat: waarden plat, positie uit de dimensies.
async function eurostat() {
  const j = await haal("https://ec.europa.eu/eurostat/api/dissemination/statistics/1.0/data/une_rt_a?age=Y15-74&sex=T&unit=PC_ACT&lastTimePeriod=1&format=JSON");
  const geo = j.dimension.geo.category.index, jaar = Object.keys(j.dimension.time.category.index)[0];
  return ISO2.filter((g) => j.value[geo[g]] != null).map((g) => ({ land: g, jaar, waarde: j.value[geo[g]] }));
}
// 2. OESO: werkelijk gewerkte uren per werkende per jaar. 13 dimensies; _T op plek 9 = alle werkenden.
async function oeso() {
  const t = await haal(`https://sdmx.oecd.org/public/rest/data/OECD.ELS.SAE,DSD_HW@DF_AVG_ANN_HRS_WKD,1.0/${ISO3.join("+")}........_T....?startPeriod=2024&format=csvfile`, "text");
  const rijen = csv(t), jaar = rijen.map((r) => r.TIME_PERIOD).sort().at(-1);   // rijen komen ongesorteerd
  return rijen.filter((r) => r.TIME_PERIOD === jaar).map((r) => ({ land: EU[r.REF_AREA], jaar, waarde: +r.OBS_VALUE }));
}
// 3. Wereldbank: levensverwachting bij geboorte. Altijd date= meegeven; het nieuwste jaar kan leeg (null) zijn.
async function wereldbank() {
  const [meta, rijen] = await haal(`https://api.worldbank.org/v2/country/${ISO3.join(";")}/indicator/SP.DYN.LE00.IN?format=json&date=2020:2026&per_page=500`);
  const metWaarde = rijen.filter((r) => r.value != null);
  const jaren = [...new Set(metWaarde.map((r) => r.date))].sort();
  const jaar = jaren.reverse().find((y) => metWaarde.filter((r) => r.date === y).length >= 24 && metWaarde.some((r) => r.date === y && r.countryiso3code === "NLD"));
  return metWaarde.filter((r) => r.date === jaar).map((r) => ({ land: EU[r.countryiso3code], jaar, waarde: r.value }));
}
// 4. Our World in Data: CO2-uitstoot per inwoner (ton). Landen met ~, 'useColumnShortNames' geeft korte kolomnamen.
async function owid() {
  const t = await haal(`https://ourworldindata.org/grapher/co-emissions-per-capita.csv?v=1&csvType=filtered&useColumnShortNames=true&country=${ISO3.join("~")}&time=2024`, "text");
  return csv(t).filter((r) => EU[r.code]).map((r) => ({ land: EU[r.code], jaar: r.year, waarde: +r.emissions_total_per_capita }));
}

const INDICATOREN = [
  ["Werkloosheid (% beroepsbevolking)", "Eurostat une_rt_a", eurostat, 1],
  ["Gewerkte uren per werkende per jaar", "OESO DF_AVG_ANN_HRS_WKD", oeso, 0],
  ["Levensverwachting bij geboorte (jaar)", "Wereldbank SP.DYN.LE00.IN", wereldbank, 1],
  ["CO2 per inwoner (ton)", "Our World in Data", owid, 1],
];
for (const [naam, bron, fn, dec] of INDICATOREN) {
  const rijen = (await fn()).sort((a, b) => b.waarde - a.waarde);
  const nl = rijen.find((r) => r.land === "NL"), plek = rijen.indexOf(nl) + 1;
  const mediaan = rijen[Math.floor(rijen.length / 2)].waarde;
  console.log(`${naam}, ${nl.jaar} (${bron})`);
  console.log(`  Nederland ${nl.waarde.toFixed(dec)}, plek ${plek} van ${rijen.length} EU-landen (1 = hoogste), mediaan ${mediaan.toFixed(dec)}`);
  console.log(`  hoogst ${rijen[0].land} ${rijen[0].waarde.toFixed(dec)}, laagst ${rijen.at(-1).land} ${rijen.at(-1).waarde.toFixed(dec)}`);
}
Werkloosheid (% beroepsbevolking), 2025 (Eurostat une_rt_a)
  Nederland 3.9, plek 21 van 27 EU-landen (1 = hoogste), mediaan 6.0
  hoogst ES 10.5, laagst CZ 2.8
Gewerkte uren per werkende per jaar, 2025 (OESO DF_AVG_ANN_HRS_WKD)
  Nederland 1436, plek 24 van 27 EU-landen (1 = hoogste), mediaan 1633
  hoogst HR 1946, laagst DE 1332
Levensverwachting bij geboorte (jaar), 2024 (Wereldbank SP.DYN.LE00.IN)
  Nederland 82.0, plek 14 van 27 EU-landen (1 = hoogste), mediaan 82.0
  hoogst SE 84.1, laagst BG 75.8
CO2 per inwoner (ton), 2024 (Our World in Data)
  Nederland 6.3, plek 7 van 27 EU-landen (1 = hoogste), mediaan 5.3
  hoogst LU 10.5, laagst MT 3.2
Where it goes wrong
- Greece is EL at Eurostat and GR or GRC everywhere else. Without a mapping table Greece silently drops out of the comparison, or appears twice.
- The OECD API returned HTTP 500 in Node as long as fetch sent its default header 'Accept-Language: *'. With 'Accept-Language: en' the same URL worked at once. You do not see this in curl or the browser.
- The newest year differs per source. On 16 October 2026 Eurostat and the OECD had 2025, the World Bank and OWID 2024. The World Bank does return 2025, but with value null. Always show the year with the figure and never mix 2024 and 2025 in one ranking.
- If you leave an OECD dimension empty you get all variants mixed (for hours: all workers and employees only). Choose every dimension on purpose and check that each country has exactly one row.
- A ranking does not say whether a difference is large. The Netherlands and Slovenia both had 3.9% unemployment; the median life expectancy was 82.0 and the Netherlands sat exactly on it. Show the values, not just the rank.
- OWID figures are often processed (per person with its own population series) and come from third parties with their own licence. The CO2 chart counts emissions within borders, without land use and without international aviation and shipping: say so.
Take it further
- Add a 'higher is better' flag per indicator and colour the bars green or red relative to the median. Turn it into a scoreboard with ten indicators.
- Add time: fetch ten years per source and show with a slider how the Dutch rank changed (Eurostat sinceTimePeriod, OECD startPeriod, World Bank date=2015:2025, OWID time=2015..2024).
- Put the same indicator from two sources side by side (unemployment from Eurostat and the OECD, life expectancy from Eurostat and the World Bank) and show where they differ.
- Go regional: Eurostat has many tables at NUTS 2 level. Put Limburg next to Liège and Aachen.
More with this data
CO₂ emissions per person in the Netherlands: higher than in 20 of the 26 other EU countries
CO₂ emissions per person in 2024, in tonnes per person. Netherlands: 6.3; EU average: 5.4. Highest: Luxembourg (10.5); lowest: Malta (3.2).
Forest as a share of land area in the Netherlands: lower than in 25 of the 26 other EU countries
Forest as a share of land area in 2024, in percent. Netherlands: 11.0. Highest: Finland (74.2); lowest: Malta (1.5).
The sources4

EurostatIn depth
Thousands of tables that put the Netherlands next to other EU countries: prices, jobs, population, health, energy. Often down to regional level.

OECD Data Explorer
Over 1,500 OECD tables on work, income, taxes, education, health, housing and the environment. Measured the same way for every member country, so good for comparing the Netherlands with countries outside Europe, such as the United States, Japan or Canada.

World Bank indicators
Population, economy, health and education by country, often from 1960. Good for the big picture, too coarse for regions. The best-known database, the World Development Indicators, has almost 1,500 indicators; on 16 October 2026 the whole API held 29,490 indicators in 70 databases.

Our World in Data
More than 4,300 charts (16 October 2026; the sitemap lists 5,425, but 1,109 of those are views of 40 multi-dimensional charts) on climate, energy, health, population and prosperity, with explanations. Behind almost every chart is a CSV with the same figures and a description of the source. The Netherlands is almost always included, next to the rest of the world.
More to build
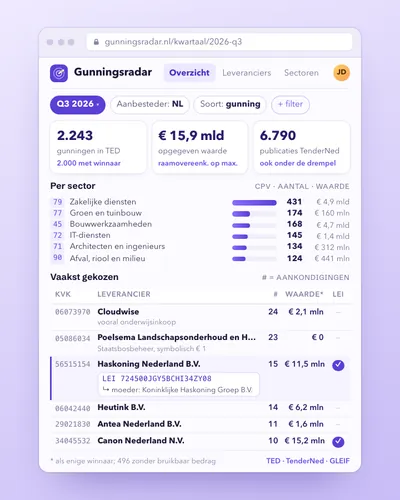 Procurement radar: who wins public contracts?Dashboard
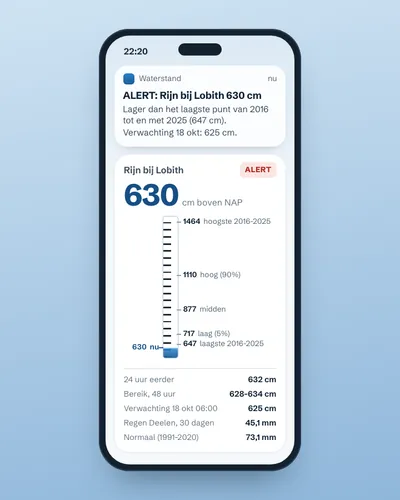 Alert when the river near you is too high or too lowAlert
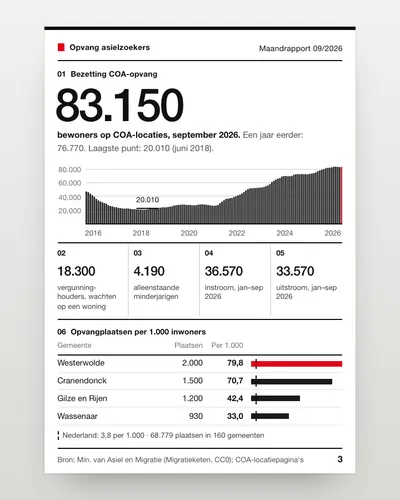 Asylum reception dashboard: national and per municipalityDashboard
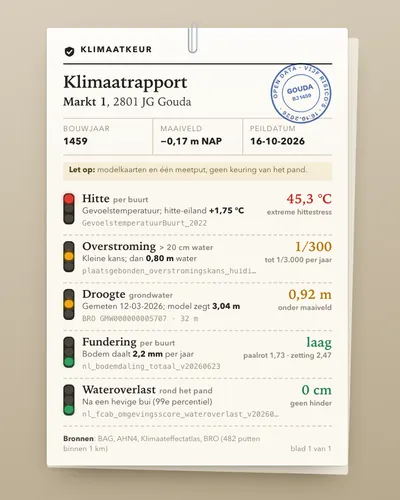 Climate risk check for an addressTool
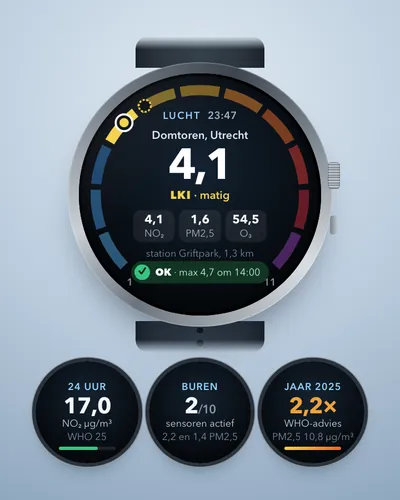 Air quality alert for your own streetAlert
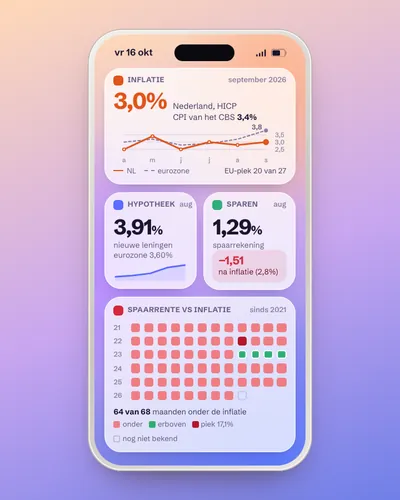 Monitor for inflation, mortgage rates and savings ratesDashboard