Earthquake tracker: every quake on the map, with municipality and homes
A map and timeline of every earthquake in the Netherlands since 1986, with magnitude, type, municipality and neighbourhood, and the number of addresses within two kilometres of the epicentre.
geef_project("aardbevingentracker")geef_bron("knmi-aardbevingen")geef_bron("pdok-wijkenbuurten")geef_bron("pdok-bag")
I have the project, the tested calls and the pitfalls. I'll build a map with KNMI earthquakes, District and neighbourhood map and Addresses and Buildings Register (BAG). This is how it could look:
You build this yourself. Copy the prompt into Claude, ChatGPT or Cursor, with the MCP server on, or follow the steps below.
5 tectonic
Induced, magnitude ≥ 1.5, per year1995–2026
Latest quakesUTC · addresses ≈ 2 km
- 09-09
08:080.8EijsdenEijsden-Margraten · Mesch2,096 - 21-08
03:502.8ZandeweerHet Hogeland · Buitengebied Kantens382 - 01-08
22:261.4VeendamVeendam · Verspreide huizen147
This is a mockup, not a working version, with the KNMI catalogue as we fetched it on 17 October 2026 at 23:31 (all earthquakes in the Netherlands in 2026) and the figures from our test run that day. Turn the MCP server on with the address on For AI.
Who it's for
Residents of Groningen and Limburg, local journalists, councillors, researchers and students writing a project on gas extraction.
What you get
A map with a dot per earthquake (size = magnitude, colour = induced or tectonic), a bar chart per year and a list of the newest quakes with municipality, neighbourhood and the number of nearby addresses. The test run on 17 October 2026 gave: in the box around the Netherlands since 1986, 4,449 events, of which 1,922 in Germany or Belgium and 27 explosions and sonic booms. In the Netherlands 2,003 induced and 497 tectonic quakes remained. For 1,939 of the 2,003 induced quakes the depth is exactly 3.0 km: a fixed value. From magnitude 1.5, 2013 was the peak year with 34 induced quakes; 2025 had 7, 2026 so far 6. The strongest was the quake of 13 April 1992 near Linne (Roermond), magnitude 5.8. The newest induced quake of magnitude 1.5 or more: Zandeweer, 21 August 2026, magnitude 2.8, in the neighbourhood Buitengebied Kantens of the municipality Het Hogeland, with 382 addresses within about 2 km.
Induced earthquakes in the Netherlands (magnitude 1.5 or more): 7 in 2025, against 34 in the peak year 2013
Induced earthquakes in the Netherlands of magnitude 1.5 or more, 1995 – 2025, in earthquakes. The highest point was 2013 (34).
How you could start6 steps
- 1
Fetch the catalogue from KNMI
The KNMI FDSN event service is open, no key. format=text gives one line per event with | as separator: EventID, time (UTC), latitude, longitude, depth, magnitude type, magnitude, place name and type. The whole box around the Netherlands since 1986 is one response of about half a megabyte. The newest comes first by default. When nothing is found you get HTTP 204 with no body (not an empty list); with nodata=404 you get a 404.
https://api.dataplatform.knmi.nl/fdsnws/event/1/query?starttime=2026-01-01&minlatitude=50.7&maxlatitude=53.7&minlongitude=3.2&maxlongitude=7.3&format=text
#EventID|Time|Latitude|Longitude|Depth/km|Author|Catalog|Contributor|ContributorID|MagType|Magnitude|MagAuthor|EventLocationName|EventType
knmi2026ujby|2026-10-14T10:50:11.699999|50.75|3.823|0.0|||KNMI|knmi2026ujby||||Geraardsbergen (België)|quarry blast
knmi2026tvmk|2026-10-07T02:08:31.3|53.207|6.756|2.5|||KNMI|knmi2026tvmk||||Froombosch|controlled explosion
knmi2026sjgb|2026-09-16T09:12:40.64655|53.46530151367188|6.108036041259766|0.0|||KNMI|knmi2026sjgb||||Schiermonnikoog|sonic boom
knmi2026sawe|2026-09-11T20:18:45.5|50.84|6.247|12.0|||KNMI|knmi2026sawe|MLs|1.0479842224688232||Eschweiler (Duitsland)|earthquake
knmi2026rwxs|2026-09-09T17:06:16.699999|50.752|5.734|12.0|||KNMI|knmi2026rwxs|MLs|1.6063406197526515||Dalhem (België)|earthquake
knmi2026rwfu|2026-09-09T08:08:56.1|50.76|5.731|12.0|||KNMI|knmi2026rwfu|MLs|0.7803586157802275||Eijsden|earthquake
knmi2026qswi|2026-08-24T10:35:46.399999|52.784|6.237|0.0|||KNMI|knmi2026qswi||||Havelte|controlled explosion
knmi2026qmut|2026-08-21T03:50:39.0000|53.378|6.667|3.0|||KNMI|knmi2026qmut|MLn|2.75655436993489||Zandeweer|induced or triggered event
…
- 2
Filter out foreign events and explosions
A rectangle around the Netherlands also catches mining quakes in the Ruhr area and quakes in Belgium: their place name ends in '(Duitsland)' or '(België)'. Also drop everything that is not a quake: quarry blast, controlled explosion, sonic boom, explosion, other event. Keep 'induced or triggered event' (mostly caused by gas extraction) and 'earthquake' (tectonic, mostly in Limburg). In 2026 up to mid-October the box held 49 lines, of which only 25 were Dutch earthquakes.
- 3
Or ask for GeoJSON for the map
format=json gives GeoJSON (format=geojson returns HTTP 400) with lat, lon, depth, mag, location, event_type, plus status and mode (reviewed/manual or automatic). Use eventtype to filter on type directly. The magnitude has many decimals (2.75655436993489): round to one decimal. The depth 3.0 is a fixed value for Groningen quakes.
https://api.dataplatform.knmi.nl/fdsnws/event/1/query?starttime=2026-01-01&minlatitude=50.7&maxlatitude=53.7&minlongitude=3.2&maxlongitude=7.3&eventtype=induced or triggered event&limit=2&format=json
{"type": "FeatureCollection", "features": [ {"type": "Feature", "id": "knmi2026qmut", "properties": {"time": "2026-08-21T03:50:39.0000", "lat": 53.378, "lon": 6.667, "depth": 3.0, "mag": 2.75655436993489, "mag_type": "MLn", "catalog": null, "contributor": "KNMI", "location": "Zandeweer", "event_type": "induced or triggered event", "status": "reviewed", "mode": "manual"}, "geometry": {"type": "Point", "coordinates": [6.667, 53.378, 3.0]}}, {"type": "Feature", "id": "knmi2026pdho", "properties": {"time": "2026-08-01T22:26:50.399999", … "mag": 1.440433077332287, … "location": "Veendam", …}, …}], "metadata": {"created": "2026-10-17T00:12:46.232349", … "sender": "KNMI", "source": "SeisComP", "count": 2}} - 4
Find municipality and neighbourhood at the epicentre
The KNMI place name is the nearest village, not the municipality: Zandeweer lies in Het Hogeland. Ask PDOK for the neighbourhood that touches a tiny box around the epicentre (OGC API districts and neighbourhoods 2026, bbox as longitude,latitude). You get bu_code, bu_naam, wk_naam, gm_code and gm_naam, but also the full neighbourhood boundary: 75 kB per call here. For hundreds of quakes, download all municipal boundaries once and do point-in-polygon yourself. An epicentre at sea or in a lake can fall in a water neighbourhood (field water JA).
https://api.pdok.nl/cbs/wijken-en-buurten-2026/ogc/v1/collections/buurten/items?f=json&limit=1&bbox=6.6669,53.3779,6.6671,53.3781
{"type":"FeatureCollection","timeStamp":"2026-10-16T22:12:52Z","numberReturned":1,"links":[…],"features":[{"type":"Feature", "properties":{"bu_code":"BU19661001","bu_naam":"Buitengebied Kantens","gm_code":"GM1966","gm_naam":"Het Hogeland","jaar":"2026", "jrgm":"2026GM1966","jrstatcode":"2026BU19661001","jrwk":"2026WK196610","water":"NEE","wk_code":"WK196610","wk_naam":"Kantens"}, "geometry":{"type":"MultiPolygon","coordinates":[[[…75.471 tekens…]]]}}]} - 5
Count the addresses around the epicentre (BAG)
The PDOK BAG WFS counts address objects (homes, shops, offices) in a box without sending them: resultType=hits returns numberMatched. Mind the order: with urn:ogc:def:crs:EPSG::4326 the bbox is latitude,longitude. With longitude,latitude the same box returned 0 objects, without an error. A count with a filter takes a few seconds; without one (all of the Netherlands) about 30 seconds. 2 km is about 0.018 degrees of latitude and 0.030 degrees of longitude at 53 degrees north.
https://service.pdok.nl/lv/bag/wfs/v2_0?service=WFS&version=2.0.0&request=GetFeature&typeNames=bag:verblijfsobject&resultType=hits&bbox=53.360,6.637,53.396,6.697,urn:ogc:def:crs:EPSG::4326
<?xml version='1.0' encoding="UTF-8" ?>
<wfs:FeatureCollection
   xmlns:bag="http://bag.geonovum.nl" …
   timeStamp="2026-10-16T22:12:46" numberMatched="378" numberReturned="0">
</wfs:FeatureCollection>
- 6
Draw map and timeline
A map with the PDOK base map (BRT) or OpenStreetMap tiles, a circle per quake sized by magnitude (one step in magnitude is about 32 times as much energy: do not scale the circle linearly). Below it the bars per year from magnitude 1.5, with 2012 (Huizinge, 3.6) highlighted. Refresh daily with updateafter=<last time> so you only fetch new or revised quakes.
How the sources fit together
- KNMI earthquakesDistrict and neighbourhood mapvia
coördinaten van het epicentrum (punt in buurtvlak), daarna gm_code en bu_codeKNMI only gives the nearest village. Through the PDOK neighbourhood boundary you get the official municipality and neighbourhood code, and with that all CBS figures per neighbourhood (residents, homes, WOZ value).
- KNMI earthquakesAddresses and Buildings Register (BAG)via
coördinaten (vak of straal rond het epicentrum)Count the BAG address objects around each epicentre. That shows which quakes touched many addresses: Sappemeer (26 July 2026, magnitude 1.6) had 5,492 addresses within about 2 km, Veendam (1 August 2026, magnitude 1.4) 147.
Let AI build it
Paste this prompt into Claude, ChatGPT, Cursor or Lovable. It names the real endpoints, the join keys and the pitfalls, so the assistant writes working code straight away. Always check the result against the source itself.
Build a map app (one HTML file with JavaScript and Leaflet or MapLibre, or Next.js) with every earthquake in the Netherlands since 1986: a dot per quake, a timeline per year and a list of the newest quakes with municipality, neighbourhood and the number of addresses within 2 km.

Data, all without a key:
1. KNMI (FDSN): https://api.dataplatform.knmi.nl/fdsnws/event/1/query?starttime=1986-01-01&minlatitude=50.7&maxlatitude=53.7&minlongitude=3.2&maxlongitude=7.3&format=json
   (or format=text: |-separated, columns EventID|Time|Latitude|Longitude|Depth/km|Author|Catalog|Contributor|ContributorID|MagType|Magnitude|MagAuthor|EventLocationName|EventType)
2. Neighbourhood and municipality (PDOK OGC API): https://api.pdok.nl/cbs/wijken-en-buurten-2026/ogc/v1/collections/buurten/items?f=json&limit=1&bbox=<lon-0.0001>,<lat-0.0001>,<lon+0.0001>,<lat+0.0001>
3. Count addresses (PDOK BAG WFS): https://service.pdok.nl/lv/bag/wfs/v2_0?service=WFS&version=2.0.0&request=GetFeature&typeNames=bag:verblijfsobject&resultType=hits&bbox=<minlat>,<minlon>,<maxlat>,<maxlon>,urn:ogc:def:crs:EPSG::4326 (read numberMatched)

What you need to know:
- The box around the Netherlands also holds German and Belgian quakes: drop place names ending in '(Duitsland)' or '(België)' (since 1986: 1,922 of the 4,449 events).
- Not everything is an earthquake: keep only event_type 'induced or triggered event' (induced) and 'earthquake' (tectonic). Drop 'quarry blast', 'controlled explosion', 'sonic boom', 'explosion', 'other event'.
- Nothing found = HTTP 204 with no body; handle it (or use nodata=404). Errors are plain text, not JSON. format=geojson does not exist (400): use format=json.
- Magnitude (mag) has many decimals: round it. Depth 3.0 km is a fixed value for 1,939 of the 2,003 induced quakes, not a measurement: do not show depth for those.
- Compare years from a fixed magnitude (1.5): the network got denser, so more and more small quakes are detected.
- The place name is the nearest village, not the municipality. Get municipality and neighbourhood from PDOK (bbox as longitude,latitude); the response includes the full neighbourhood boundary (tens of kB). For many quakes: download all municipal boundaries once (collection gemeenten) and do point-in-polygon with Turf.
- BAG WFS: with urn:ogc:def:crs:EPSG::4326 the bbox is latitude,longitude; swapped gives 0 without an error. 2 km is about 0.018 degrees of latitude and 0.030 degrees of longitude.
- Refresh with updateafter=<time of the previous run>. Attribution: KNMI (CC BY 4.0), PDOK/CBS and Kadaster (BAG).

Output: a map with circles (radius by magnitude, not linear; induced orange, tectonic blue), a filter on magnitude and period, a bar chart per year from magnitude 1.5, and a list of the ten newest quakes with time (Dutch time, the source is UTC), magnitude, place, municipality, neighbourhood and the number of addresses within 2 km.
Try it yourself
The core of the project in a small script. Needs: Node 20+ (fetch zit erin), geen pakketten. Tested on 2026-10-17; below is the real output of that run.
// Aardbevingentracker: alle bevingen rond Nederland van het KNMI, met gemeente, buurt en aantal adressen in de buurt.
// Bronnen: KNMI (FDSN event-dienst), PDOK (wijk- en buurtkaart 2026, OGC API) en PDOK BAG (WFS). Geen sleutel nodig.
// Draai met: node bevingen.mjs   (Node 20+)
const UA = { "User-Agent": "mijn-project/1.0 (+jij@voorbeeld.nl)" };
const haal = async (url, soort = "json") => { const r = await fetch(url, { headers: UA }); if (!r.ok) throw new Error(`${r.status} ${url}`); return soort === "json" ? r.json() : r.text(); };

// 1. De hele catalogus in het vak rond Nederland als tekst (|-gescheiden). Niets gevonden = HTTP 204 zonder inhoud.
const tekst = await haal("https://api.dataplatform.knmi.nl/fdsnws/event/1/query?starttime=1986-01-01&minlatitude=50.7&maxlatitude=53.7&minlongitude=3.2&maxlongitude=7.3&format=text", "text");
const [kop, ...regels] = tekst.trim().split("\n");
const alle = regels.map((r) => { const k = r.split("|"); return { id: k[0], tijd: k[1], lat: +k[2], lon: +k[3], diepte: +k[4], kracht: k[10] === "" ? null : +k[10], plaats: k[12], soort: k[13] }; });
// Het vak bevat ook Duitsland en België, en niet alles is een beving (explosies, knallen): filter op beide.
const buitenland = (b) => /\((Duitsland|België)\)$/.test(b.plaats);
const nl = alle.filter((b) => !buitenland(b) && (b.soort === "induced or triggered event" || b.soort === "earthquake"));
const geinduceerd = nl.filter((b) => b.soort === "induced or triggered event");
console.log(`KNMI sinds 1986 in het vak: ${alle.length} gebeurtenissen, ${alle.filter(buitenland).length} in Duitsland of België, ` +
  `${alle.filter((b) => !buitenland(b) && !nl.includes(b)).length} explosies e.d.; in Nederland ${geinduceerd.length} geïnduceerd en ${nl.length - geinduceerd.length} tektonisch`);
const drie = geinduceerd.filter((b) => b.diepte === 3).length;
console.log(`Diepte precies 3,0 km bij ${drie} van de ${geinduceerd.length} geïnduceerde bevingen (vaste waarde, geen meting)`);

// 2. Per jaar vanaf kracht 1,5: kleine bevingen hangen af van het aantal meetstations, dus tel vanaf een vaste kracht.
const perJaar = {};
for (const b of geinduceerd) if (b.kracht >= 1.5) perJaar[b.tijd.slice(0, 4)] = (perJaar[b.tijd.slice(0, 4)] ?? 0) + 1;
const jaren = Object.entries(perJaar).sort();
const piek = jaren.reduce((a, b) => (b[1] > a[1] ? b : a));
console.log(`Geïnduceerd, kracht 1,5 of meer: piek ${piek[0]} (${piek[1]}), ` + jaren.filter(([j]) => j >= "2020").map(([j, n]) => `${j} ${n}`).join(", "));
const sterkste = [...nl].sort((a, b) => b.kracht - a.kracht).slice(0, 3);
console.log("Sterkste in Nederland:", sterkste.map((b) => `${b.plaats} ${b.tijd.slice(0, 10)} M${b.kracht.toFixed(1)}`).join("; "));

// 3. De vijf nieuwste bevingen in Nederland met gemeente en buurt (PDOK OGC API, klein vak rond het epicentrum)
//    en het aantal adressen (BAG-verblijfsobjecten) binnen ongeveer 2 km.
console.log("\nNieuwste bevingen:");
for (const b of nl.slice(0, 5)) {   // de tekst-uitvoer staat standaard op tijd, nieuwste eerst
  const d = 0.0001;
  const bu = await haal(`https://api.pdok.nl/cbs/wijken-en-buurten-2026/ogc/v1/collections/buurten/items?f=json&limit=1&bbox=${b.lon - d},${b.lat - d},${b.lon + d},${b.lat + d}`);
  const p = bu.features[0]?.properties;
  const dlat = 2 / 111.32, dlon = 2 / (111.32 * Math.cos((b.lat * Math.PI) / 180));
  // WFS 2.0 met urn:ogc:def:crs:EPSG::4326: bbox als breedte,lengte. resultType=hits telt zonder objecten te sturen.
  const hits = await haal(`https://service.pdok.nl/lv/bag/wfs/v2_0?service=WFS&version=2.0.0&request=GetFeature&typeNames=bag:verblijfsobject&resultType=hits&bbox=${b.lat - dlat},${b.lon - dlon},${b.lat + dlat},${b.lon + dlon},urn:ogc:def:crs:EPSG::4326`, "text");
  const adressen = hits.match(/numberMatched="(\d+)"/)[1];
  console.log(`  ${b.tijd.slice(0, 16).replace("T", " ")} UTC  M${b.kracht?.toFixed(1) ?? "?"}  ${b.plaats.padEnd(14)} ${b.soort === "earthquake" ? "tektonisch " : "geïnduceerd"}  ` +
    `${p ? `${p.gm_naam}, ${p.bu_naam} (${p.bu_code})` : "geen buurt (zee?)"}  ${adressen} adressen binnen ~2 km`);
}
KNMI sinds 1986 in het vak: 4449 gebeurtenissen, 1922 in Duitsland of België, 27 explosies e.d.; in Nederland 2003 geïnduceerd en 497 tektonisch
Diepte precies 3,0 km bij 1939 van de 2003 geïnduceerde bevingen (vaste waarde, geen meting)
Geïnduceerd, kracht 1,5 of meer: piek 2013 (34), 2020 17, 2021 13, 2022 13, 2023 11, 2024 7, 2025 7, 2026 6
Sterkste in Nederland: Linne 1992-04-13 M5.8; Sint Odiliënberg 1992-04-13 M4.0; Voerendaal 2001-06-23 M3.9

Nieuwste bevingen:
  2026-09-09 08:08 UTC  M0.8  Eijsden        tektonisch   Eijsden-Margraten, Mesch (BU19030003)  2096 adressen binnen ~2 km
  2026-08-21 03:50 UTC  M2.8  Zandeweer      geïnduceerd  Het Hogeland, Buitengebied Kantens (BU19661001)  382 adressen binnen ~2 km
  2026-08-01 22:26 UTC  M1.4  Veendam        geïnduceerd  Veendam, Verspreide huizen (BU00470109)  147 adressen binnen ~2 km
  2026-07-31 18:05 UTC  M1.0  Meerssen       tektonisch   Meerssen, Verspreide huizen (BU09380009)  4818 adressen binnen ~2 km
  2026-07-26 17:08 UTC  M1.6  Sappemeer      geïnduceerd  Midden-Groningen, Sappemeer-Noord (BU19520409)  5492 adressen binnen ~2 km
Where it goes wrong
- The box around the Netherlands is larger than the Netherlands: since 1986, 1,922 of the 4,449 events came from Germany or Belgium. Without a filter on '(Duitsland)' and '(België)' in the place name, Limburg looks far more restless than it is.
- Not every line is an earthquake: quarry blasts, controlled explosions and sonic booms (Schiermonnikoog, September 2026) are in the same catalogue, without a magnitude. Filter on EventType.
- The depth of 3.0 km for 1,939 of the 2,003 induced quakes is a fixed assumption (about the depth of the Groningen field), not a measurement. Do not build a depth map from it.
- More small quakes does not always mean more quakes: the network got denser. Compare years from a fixed magnitude, for example 1.5 (peak 2013 with 34, 2025 with 7).
- Axis order differs per service: the KNMI service uses separate parameters (minlatitude, minlongitude), the PDOK OGC API wants bbox as longitude,latitude, the BAG WFS with urn:ogc:def:crs:EPSG::4326 latitude,longitude. A wrong order in the WFS gave 0 addresses without an error.
- The KNMI place name is the nearest village. It can lie in a different municipality than you expect (Zandeweer in Het Hogeland, Sappemeer in Midden-Groningen), and the epicentre itself is often in a rural area. Count per municipality based on coordinates, not names.
- Times are UTC. The Zandeweer quake at 03:50 UTC on 21 August 2026 happened at 05:50 Dutch time. Convert before you write 'last night' or 'this morning'.
Take it further
- Show how hard the ground shook per quake: for 66 quakes KNMI has a ShakeMap with ground acceleration per station (shakemaps/7/download/<id>/rrsm.json).
- Join the neighbourhood code to CBS key figures (residents, homes, average WOZ value) and put the number of quakes per neighbourhood next to home values.
- Turn it into an alert: run a query with updateafter every hour and send a message for a quake of magnitude 2 or more in your municipality.
- Put the quakes per year next to gas production from the Groningen field and the decisions to reduce it, starting from Huizinge (August 2012).
More with this data
Induced earthquakes by place: most Garrelsweer (89 earthquakes), then Appingedam and Loppersum
Induced earthquakes by place, 1986–2026, in earthquakes. Total: 2,004; the largest 12 of 187 categories are shown. Garrelsweer is 4% of the total. Place = the place name KNMI gives the earthquake (nearest village). All magnitudes, whole catalogue.
The sources3

KNMI earthquakes
KNMI's earthquake catalogue as an open service: time, place, depth, magnitude and type of every event, plus stations, waveforms and ShakeMaps (ground motion per earthquake). On 16 October 2026 the box around the Netherlands held 4,551 events since 1911, of which 3,493 induced (by gas extraction or mining). In the Netherlands itself that is 2,003 induced earthquakes since 1986; the strongest was Huizinge on 16 August 2012 (magnitude 3.6).

District and neighbourhood map
The official boundaries of all municipalities, districts and neighbourhoods, as a map service (WFS) and download. The geometry you need to map neighbourhood figures.

Addresses and Buildings Register (BAG)
Every address and building in the Netherlands with year of construction, floor area and use. The backbone for anything linked at address level.
More to build
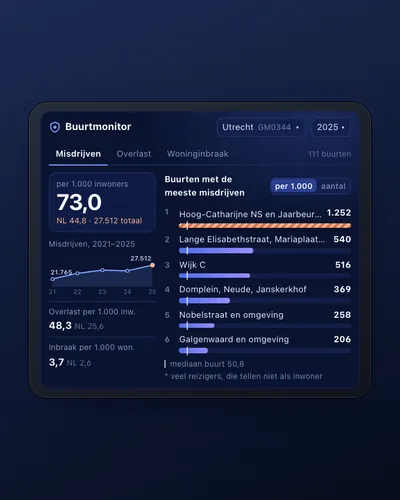 Neighbourhood safety monitor: nuisance and crime per neighbourhoodDashboard
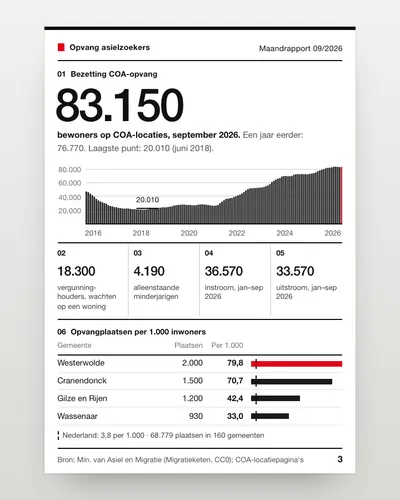 Asylum reception dashboard: national and per municipalityDashboard
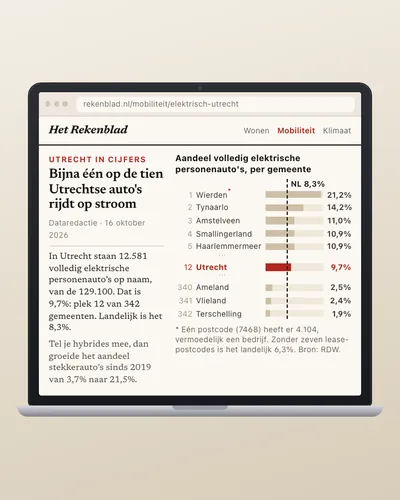 How fast is your municipality going electric?Analysis
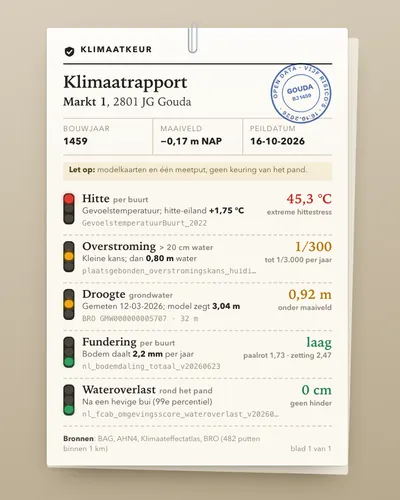 Climate risk check for an addressTool
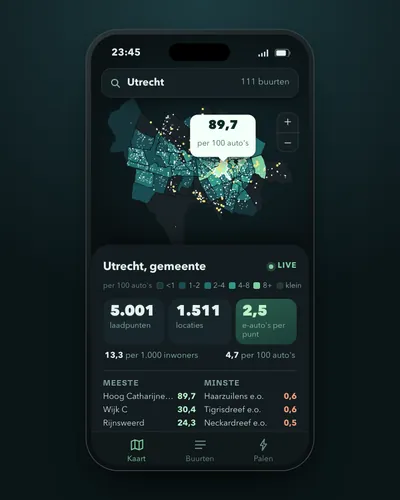 Charging points per neighbourhood and per electric carMap
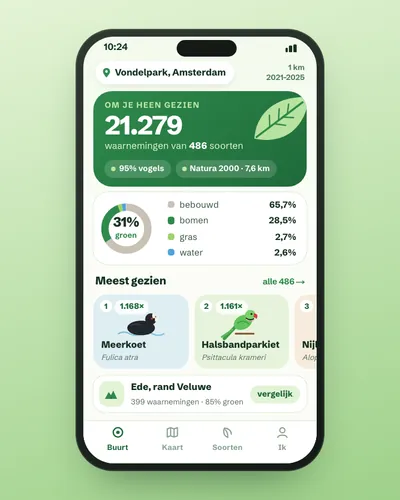 Nature in your neighbourhood: which species were seen and how green is it?App