Neighbourhood safety monitor: nuisance and crime per neighbourhood
A dashboard that shows, for every neighbourhood in your municipality, how much nuisance and crime the police record, per 1,000 residents and over the years, with a map and a comparison with the whole of the Netherlands.
geef_project("buurtmonitor-veiligheid")geef_bron("politie-overlast")geef_bron("politie-misdrijven")geef_bron("cbs-kwb")
I have the project, the tested calls and the pitfalls. I'll build a dashboard with Registered nuisance by neighbourhood, Registered crime by neighbourhood, Key figures for districts and neighbourhoods and District and neighbourhood map. This is how it could look:
You build this yourself. Copy the prompt into Claude, ChatGPT or Cursor, with the MCP server on, or follow the steps below.
Neighbourhoods with most crimesper 1,000count
- 1Hoog-Catharijne NS en Jaarbeurs*1,252
- 2Lange Elisabethstraat, Mariaplaats e.o.540
- 3Wijk C516
- 4Domplein, Neude, Janskerkhof369
- 5Nobelstraat en omgeving258
- 6Galgenwaard en omgeving206
median neighbourhood 50.8* many travellers, not counted as residents
This is a mockup, not a working version, with the figures from our test run on 16 October 2026 for Utrecht (police via CBS, 2021–2025; neighbourhoods with at least 1,000 residents). Turn the MCP server on with the address on For AI.
Who it's for
Councillors and neighbourhood officers who want to know where things are strained, local journalists, residents' associations and anyone who wants to check whether 'it is getting less safe' in their own area.
What you get
A dashboard in three parts: a map of the neighbourhoods in your municipality, coloured by crime or nuisance per 1,000 residents; a line with the years 2021 to 2025 for the whole municipality; and a table per neighbourhood with residents, crimes, nuisance and burglaries per 1,000 homes.
Test run on 16 October 2026 for Utrecht (GM0344, 111 neighbourhoods, 376,770 residents and 168,736 homes according to the 2025 key figures): - In 2025 the police in Utrecht recorded 27,512 crimes (73.0 per 1,000 residents) and 18,181 nuisance reports (48.3 per 1,000). For the whole of the Netherlands that was 808,021 crimes (44.8 per 1,000 of 18,044,027 residents) and 461,940 nuisance reports (25.6 per 1,000). - Crime in Utrecht rose from 21,765 in 2021 to 27,512 in 2025. Nuisance first fell (16,342 in 2022, 15,478 in 2024) and rose again in 2025. - Burglary: 629 in 2025, 3.7 per 1,000 homes (nationally 21,624, 2.6 per 1,000 homes). In 2024 Utrecht had 399. - The neighbourhood Hoog-Catharijne NS en Jaarbeurs tops the list with 1,252 crimes per 1,000 residents, because tens of thousands of travellers and visitors pass through every day who don't count as residents. The median neighbourhood (with at least 1,000 residents) had 50.8 crimes and 35.2 nuisance reports per 1,000 residents. The same script works for every municipality: for Amsterdam (517 neighbourhoods) it also took about a second.
Registered nuisance: 462 thousand reports per year in 2025, 65% more than in 2012
Registered nuisance, 2012 – 2025, in thousand reports per year. The highest point was 2021 (537).
How you could start6 steps
- 1
Pick your municipality and fetch its neighbourhoods
The police tables have their own list of areas. Filter on Municipality (without padding) and you get the municipality, its districts (WK) and its neighbourhoods (BU) with their names. Utrecht has 10 districts and 111 neighbourhoods. Note: the Key holds the municipality code padded with spaces to 10 characters ('GM0344 '), the district code too ('WK034401 '). Neighbourhood codes are exactly 10 characters already. In Amsterdam they contain letters (BU0363AE01). The police convert all years to the 2025 neighbourhood boundaries, so use residents and boundaries from 2025 as well.
https://dataderden.cbs.nl/ODataApi/OData/47024NED/WijkenEnBuurten?$filter=Municipality eq 'GM0344'&$format=json
{ "odata.metadata":"https://dataderden.cbs.nl/ODataApi/OData/47024NED/$metadata#Cbs.OData.WebAPI.WijkenEnBuurten","value":[ { "Key":"GM0344 ","Title":"Utrecht","Description":"Gemeente 'Utrecht' (GM0344)","Municipality":"GM0344","DetailRegionCode":"GM0344" },{ "Key":"WK034401 ","Title":"Wijk 01 West","Description":"Wijk 'Wijk 01 West' (WK034401) is een wijk in de gemeente 'Utrecht'.", ... },{ "Key":"BU03440111","Title":"Welgelegen, Den Hommel","Description":"Buurt 'Welgelegen, Den Hommel' (BU03440111) is een buurt in wijk 'Wijk 01 West' in de gemeente 'Utrecht'.", ... - 2
Fetch nuisance per neighbourhood (table 47024NED)
Nuisance has yearly totals ('2025JJ00') next to months. With substringof('BU0344',WijkenEnBuurten) you get all neighbourhoods of the municipality in one call. The code for the total is '0.0.0 ' with a trailing space; without it you get an empty list and no error. Other types: 'E33 ' confused person, 'E35 ' youth, 'E38 ' alcohol or drugs, 'M22 ' noise. Note: the neighbourhoods together (17,974 in 2025) add up to slightly less than the municipality (18,181). About 1% of reports has no neighbourhood.
https://dataderden.cbs.nl/ODataApi/OData/47024NED/TypedDataSet?$filter=Overlast eq '0.0.0 ' and substringof('BU0344',WijkenEnBuurten) and Perioden eq '2025JJ00'&$select=WijkenEnBuurten,Perioden,GeregistreerdeOverlast_1&$format=json
{ "odata.metadata":"https://dataderden.cbs.nl/ODataApi/OData/47024NED/$metadata#Cbs.OData.WebAPI.TypedDataSet&$select=WijkenEnBuurten,Perioden,GeregistreerdeOverlast_1","value":[ { "WijkenEnBuurten":"BU03440111","Perioden":"2025JJ00","GeregistreerdeOverlast_1":109 },{ "WijkenEnBuurten":"BU03440112","Perioden":"2025JJ00","GeregistreerdeOverlast_1":135 },{ "WijkenEnBuurten":"BU03440113","Perioden":"2025JJ00","GeregistreerdeOverlast_1":55 },{ ... - 3
Fetch crime per neighbourhood (table 47022NED)
The crime table has 59 types but no yearly totals: only months (2012MM01 to 2026MM09). Add up the twelve months yourself. Months without crime are included, with 0. Burglary is type '1.1.1 ' (with a space too). Important: a query that would return more than 10,000 rows gives HTTP 500 with 'Please redefine your query so that it returns less than 10000 records' and no odata.nextLink. For Amsterdam (517 neighbourhoods × 12 months × 2 types = 12,408 rows) you therefore have to ask per type.
https://dataderden.cbs.nl/ODataApi/OData/47022NED/TypedDataSet?$filter=SoortMisdrijf eq '1.1.1 ' and WijkenEnBuurten eq 'BU03440712' and substringof('2025MM',Perioden)&$select=Perioden,GeregistreerdeMisdrijven_1&$format=json
{ "odata.metadata":"https://dataderden.cbs.nl/ODataApi/OData/47022NED/$metadata#Cbs.OData.WebAPI.TypedDataSet&$select=Perioden,GeregistreerdeMisdrijven_1","value":[ { "Perioden":"2025MM01","GeregistreerdeMisdrijven_1":2 },{ "Perioden":"2025MM02","GeregistreerdeMisdrijven_1":1 },{ "Perioden":"2025MM03","GeregistreerdeMisdrijven_1":0 },{ ... - 4
Fetch residents and homes per neighbourhood (key figures 2025)
The denominator comes from the Key figures for districts and neighbourhoods 2025 (table 86165NED), the same boundaries as the police figures. Number of residents is T001036, the housing stock M000297. Divide burglaries by homes, not by residents. We use the newer CBS API at datasets.cbs.nl (OData v4): codes there have no padding and the number is in Value. On 16 October 2026 around 23:30 the old API at opendata.cbs.nl returned 503 (Service Unavailable), while datasets.cbs.nl answered normally. Utrecht: 111 neighbourhoods, together 376,770 residents and 168,736 homes.
https://datasets.cbs.nl/odata/v1/CBS/86165NED/Observations?$filter=startswith(WijkenEnBuurten,'BU0344') and (Measure eq 'T001036' or Measure eq 'M000297')&$select=WijkenEnBuurten,Measure,Value
{"@odata.context":"https://datasets.cbs.nl/odata/v1/CBS/86165NED/$metadata#Observations(WijkenEnBuurten,Measure,Value)","value":[ {"Measure":"T001036","Value":1880.0,"WijkenEnBuurten":"BU03440111"}, {"Measure":"M000297","Value":911.0,"WijkenEnBuurten":"BU03440111"}, {"Measure":"T001036","Value":4105.0,"WijkenEnBuurten":"BU03440112"}, {"Measure":"M000297","Value":1428.0,"WijkenEnBuurten":"BU03440112"}, ... - 5
Fetch the neighbourhood boundaries for the map (PDOK)
The 2025 district and neighbourhood map is on PDOK as a WFS. Ask for srsName=EPSG:4326 for a web map (Leaflet, MapLibre). Pitfall: this MapServer WFS silently ignores a cql_filter and then sends the first 1,000 neighbourhoods of the country (49 MB, the first being 'Buitenland' with -99997 residents). So filter with an FES filter in the filter parameter (XML, URL-encoded). Then you get exactly 111 neighbourhoods with geometry, 474 kB. The layer also has aantalInwoners (for Utrecht the same 376,770), handy if you want to skip the key figures; negative values are codes for confidential or unknown.
https://service.pdok.nl/cbs/wijkenbuurten/2025/wfs/v1_0?request=GetFeature&service=WFS&version=2.0.0&typeNames=wijkenbuurten:buurten&outputFormat=application/json&srsName=EPSG:4326&propertyName=buurtcode,buurtnaam,aantalInwoners&filter=<Filter xmlns%3D"http%3A%2F%2Fwww.opengis.net%2Ffes%2F2.0"><PropertyIsEqualTo><ValueReference>gemeentecode<%2FValueReference><Literal>GM0344<%2FLiteral><%2FPropertyIsEqualTo><%2FFilter>
{ "type": "FeatureCollection", "numberMatched": 111, "name": "buurten", "features": [ { "type": "Feature", "properties": { "buurtcode": "BU03440111", "buurtnaam": "Welgelegen, Den Hommel", "aantalInwoners": 1880 }, "geometry": { "type": "MultiPolygon", "coordinates": [ [ [ [ 5.095490997659927, 52.086681703224 ], ... - 6
Build the trend for the municipality and compare it with the Netherlands
For the line over time, query the municipality itself ('GM0344 ', ten characters) and, for comparison, the whole country ('NL00 '). Start the line in 2021 or 2022: in March 2021 the police changed how nuisance is recorded ('confused person' in particular jumped), so don't compare 2020 with later years. Divide each year by residents; using the 2025 key figures for every year is an approximation, because Utrecht is growing. A municipality code without padding ('GM0344') returns an empty list.
https://dataderden.cbs.nl/ODataApi/OData/47022NED/TypedDataSet?$filter=WijkenEnBuurten eq 'GM0344 ' and SoortMisdrijf eq '0.0.0 ' and Perioden eq '2025MM12'&$format=json
{
  "odata.metadata":"https://dataderden.cbs.nl/ODataApi/OData/47022NED/$metadata#Cbs.OData.WebAPI.TypedDataSet","value":[
    {
      "ID":2732162,"SoortMisdrijf":"0.0.0 ","WijkenEnBuurten":"GM0344    ","Perioden":"2025MM12","GeregistreerdeMisdrijven_1":2192
    }
  ]
}
How the sources fit together
- Registered nuisance by neighbourhoodKey figures for districts and neighbourhoodsvia
buurtcode (BU03440111), indeling 2025The 2025 key figures (86165NED) provide residents per neighbourhood. Nuisance per 1,000 residents is fairer than the raw count: big neighbourhoods naturally have more reports. In the police table the neighbourhood code is 10 characters without spaces, in the key figures (OData v4) too: they match one to one. For Utrecht all 111 neighbourhoods matched.
- Registered crime by neighbourhoodKey figures for districts and neighbourhoodsvia
buurtcode, woningvoorraad (M000297)Divide burglary by the number of homes, not by residents: a neighbourhood with many single-person households has relatively more homes. Utrecht 2025: 629 burglaries on 168,736 homes is 3.7 per 1,000 homes.
- Registered nuisance by neighbourhoodDistrict and neighbourhood mapvia
buurtcode = buurtcode in de WFS-laag wijkenbuurten:buurten (2025)The boundaries turn the table into a map. Use the service from the same year as the police figures' classification (now 2025): with the 2024 boundaries you miss renamed and split neighbourhoods.
- Registered crime by neighbourhoodRegistered nuisance by neighbourhoodvia
zelfde buurtcodes en perioden (2025MM01)Both tables come from the police via CBS and use the same areas and months. That lets you see per neighbourhood whether it is mostly nuisance (reports, not an offence) or crime. Galgenwaard in Utrecht: 206 crimes but only 13 nuisance reports per 1,000 residents (football stadium).
Let AI build it
Paste this prompt into Claude, ChatGPT, Cursor or Lovable. It names the real endpoints, the join keys and the pitfalls, so the assistant writes working code straight away. Always check the result against the source itself.
Build a neighbourhood safety monitor as a single web page (HTML + JavaScript, with Leaflet or MapLibre for the map and a small chart library). I pick a municipality and see:
1. a map of all neighbourhoods, coloured by crime or nuisance per 1,000 residents in the latest full year (toggle);
2. a line from 2021 to the latest full year for the municipality and for the whole of the Netherlands, per 1,000 residents;
3. a sortable table per neighbourhood: residents, crimes, nuisance, burglaries per 1,000 homes, and the change compared with the previous year.

Data sources (all open, no key, CORS open):
- Nuisance: https://dataderden.cbs.nl/ODataApi/OData/47024NED/TypedDataSet?$filter=Overlast eq '0.0.0 ' and substringof('BU0344',WijkenEnBuurten) and Perioden eq '2025JJ00'&$format=json
  Field GeregistreerdeOverlast_1. Has yearly totals (2025JJ00) and months (2025MM01).
- Crime: https://dataderden.cbs.nl/ODataApi/OData/47022NED/TypedDataSet?$filter=SoortMisdrijf eq '0.0.0 ' and substringof('BU0344',WijkenEnBuurten) and substringof('2025MM',Perioden)&$format=json
  Field GeregistreerdeMisdrijven_1. Months only: add them up to a year yourself. Burglary = SoortMisdrijf '1.1.1 '.
- Neighbourhood names: https://dataderden.cbs.nl/ODataApi/OData/47024NED/WijkenEnBuurten?$filter=Municipality eq 'GM0344'&$format=json
- Residents and homes per neighbourhood (key figures 2025, OData v4): https://datasets.cbs.nl/odata/v1/CBS/86165NED/Observations?$filter=startswith(WijkenEnBuurten,'BU0344') and (Measure eq 'T001036' or Measure eq 'M000297')&$select=WijkenEnBuurten,Measure,Value
  T001036 = residents, M000297 = housing stock. The Netherlands = 'NL00'.
- Boundaries: PDOK WFS https://service.pdok.nl/cbs/wijkenbuurten/2025/wfs/v1_0, typeNames=wijkenbuurten:buurten, outputFormat=application/json, srsName=EPSG:4326, propertyName=buurtcode,buurtnaam, and an FES filter in the filter parameter:
  <Filter xmlns="http://www.opengis.net/fes/2.0"><PropertyIsEqualTo><ValueReference>gemeentecode</ValueReference><Literal>GM0344</Literal></PropertyIsEqualTo></Filter>

Pitfalls to handle:
- In the police tables (OData v3) keys are padded with spaces to a fixed length: '0.0.0 ', '1.1.1 ', 'E33   ', 'GM0344    ' (10 characters), 'NL00      '. Without the spaces you get an empty list and no error. Neighbourhood codes are 10 characters already (BU03440111; in Amsterdam with letters: BU0363AE01).
- In the key figures (OData v4 at datasets.cbs.nl) codes have no padding. Don't mix them up.
- A query that would return more than 10,000 rows fails with HTTP 500 ('returns less than 10000 records'), without odata.nextLink. Split per type or per year. Do follow odata.nextLink when it is there.
- Use the 2025 neighbourhood boundaries for everything (the police convert all years to 2025): key figures 86165NED and the PDOK 2025 service.
- The PDOK WFS (MapServer) ignores cql_filter and then returns 1,000 random neighbourhoods (49 MB). Only the FES filter works.
- Series break in March 2021 for nuisance: don't start the line before 2021 and add a note.
- Neighbourhoods with fewer than 1,000 residents: grey and 'too few residents to compare'. City centre and station areas score extremely high per resident because of visitors; explain that (no 'most dangerous neighbourhood' ranking).
- A registration is not an incident: what nobody reports isn't there. Older months are revised: always reload the full series.
- About 1% of nuisance has no neighbourhood: the municipality total is a bit higher than the sum of neighbourhoods. Show the municipality total from the municipality row.
- Negative values in PDOK (-99997) are codes for confidential or unknown, not numbers.

Check: for Utrecht (GM0344) in 2025 you should get 27,512 crimes, 18,181 nuisance reports, 629 burglaries, 111 neighbourhoods and 376,770 residents. The Netherlands in 2025: 808,021 crimes and 461,940 nuisance reports.
Under the dashboard, show the source: 'Police via CBS (47022NED, 47024NED), CBS Key figures for districts and neighbourhoods 2025, PDOK. CC BY 4.0' and the newest month in the data.
Try it yourself
The core of the project in a small script. Needs: Node 20 of nieuwer (ingebouwde fetch), geen pakketten. Opslaan als buurtmonitor.mjs en draaien met: node buurtmonitor.mjs 0344. Tested on 2026-10-16; below is the real output of that run.
// Buurtmonitor veiligheid: overlast en misdrijven per buurt, per 1.000 inwoners, door de tijd.
// Bronnen: politie via CBS (47024NED overlast, 47022NED misdrijven), CBS kerncijfers wijken en buurten 2025
// (86165NED: inwoners en woningen) en PDOK wijken en buurten 2025 (grenzen). Geen sleutel nodig.
// Draai met: node buurtmonitor.mjs [gemeentecode zonder GM]
const UA = { "User-Agent": "mijn-buurtmonitor/1.0 (+jij@voorbeeld.nl)" };
const POLITIE = "https://dataderden.cbs.nl/ODataApi/OData";
const KWB = "https://datasets.cbs.nl/odata/v1/CBS/86165NED"; // kerncijfers 2025, zelfde buurtindeling als de politietabellen
const PDOK = "https://service.pdok.nl/cbs/wijkenbuurten/2025/wfs/v1_0";
const GM = process.argv[2] ?? "0344"; // Utrecht
const JAREN = [2021, 2022, 2023, 2024, 2025];

async function json(url) {
  const r = await fetch(url, { headers: UA });
  if (!r.ok) throw new Error(`${r.status} ${url}`);
  return r.json();
}
// Politie (OData v3): volg odata.nextLink als die er is; een vraag die meer dan 10.000 rijen zou geven, faalt met HTTP 500
async function politie(tabel, filter, select) {
  let url = `${POLITIE}/${tabel}/TypedDataSet?` + new URLSearchParams({ $filter: filter, $select: select, $format: "json" });
  const uit = [];
  while (url) { const j = await json(url); uit.push(...j.value); url = j["odata.nextLink"]; }
  return uit;
}
const som = (rijen, veld) => rijen.reduce((a, r) => a + (r[veld] ?? 0), 0);
const per1000 = (n, d) => (n / d * 1000).toFixed(1);

// 1. Inwoners (T001036) en woningen (M000297) per buurt. OData v4: codes zonder opvulspaties.
const kwb = await json(`${KWB}/Observations?` + new URLSearchParams({
  $filter: `startswith(WijkenEnBuurten,'BU${GM}') and (Measure eq 'T001036' or Measure eq 'M000297')`,
  $select: "WijkenEnBuurten,Measure,Value" }));
const buurt = {};
for (const o of kwb.value) {
  const b = (buurt[o.WijkenEnBuurten] ??= { overlast: 0, misdrijf: 0, inbraak: 0 });
  b[o.Measure === "T001036" ? "inw" : "won"] = o.Value;
}
const inw = Object.values(buurt).reduce((a, b) => a + (b.inw ?? 0), 0);
const won = Object.values(buurt).reduce((a, b) => a + (b.won ?? 0), 0);

// 2. Grenzen en namen uit PDOK. Deze MapServer negeert cql_filter (dan 1.000 buurten, 49 MB): gebruik een FES-filter.
const fes = `<Filter xmlns="http://www.opengis.net/fes/2.0"><PropertyIsEqualTo><ValueReference>gemeentecode</ValueReference><Literal>GM${GM}</Literal></PropertyIsEqualTo></Filter>`;
const geo = await json(`${PDOK}?` + new URLSearchParams({ request: "GetFeature", service: "WFS", version: "2.0.0",
  typeNames: "wijkenbuurten:buurten", outputFormat: "application/json", srsName: "EPSG:4326",
  propertyName: "buurtcode,buurtnaam,gemeentenaam", filter: fes }));
for (const f of geo.features) if (buurt[f.properties.buurtcode]) buurt[f.properties.buurtcode].naam = f.properties.buurtnaam;
const gekoppeld = geo.features.filter((f) => buurt[f.properties.buurtcode]).length;
console.log(`${geo.features[0].properties.gemeentenaam} (GM${GM}): ${Object.keys(buurt).length} buurten, ${inw.toLocaleString("nl-NL")} inwoners en ${won.toLocaleString("nl-NL")} woningen (kerncijfers 2025), ${gekoppeld} grenzen gekoppeld`);

// 3. Trend voor de hele gemeente. Overlast heeft jaartotalen (JJ00); misdrijven alleen maanden, dus zelf optellen.
const g = `WijkenEnBuurten eq 'GM${GM}    '`; // gemeentecode in de politietabellen: aangevuld tot 10 tekens
const ov = await politie("47024NED", `${g} and Overlast eq '0.0.0 ' and substringof('JJ',Perioden)`, "Perioden,GeregistreerdeOverlast_1");
const mi = await politie("47022NED", `${g} and (SoortMisdrijf eq '0.0.0 ' or SoortMisdrijf eq '1.1.1 ')`, "SoortMisdrijf,Perioden,GeregistreerdeMisdrijven_1");
console.log("\nJaar  overlast  misdrijven  woninginbraak | per 1.000 inw: overlast misdr. | inbraak per 1.000 woningen");
for (const j of JAREN) {
  const o = som(ov.filter((r) => r.Perioden === `${j}JJ00`), "GeregistreerdeOverlast_1");
  const m = som(mi.filter((r) => r.Perioden.startsWith(`${j}MM`) && r.SoortMisdrijf === "0.0.0 "), "GeregistreerdeMisdrijven_1");
  const i = som(mi.filter((r) => r.Perioden.startsWith(`${j}MM`) && r.SoortMisdrijf === "1.1.1 "), "GeregistreerdeMisdrijven_1");
  console.log(`${j} ${String(o).padStart(9)} ${String(m).padStart(11)} ${String(i).padStart(14)} | ${per1000(o, inw).padStart(19)} ${per1000(m, inw).padStart(6)} | ${per1000(i, won).padStart(5)}`);
}

// 4. Per buurt in 2025. Buurtcodes zijn al 10 tekens, dus daar geen opvulling; soortcodes wel ('0.0.0 ', '1.1.1 ').
const ovB = await politie("47024NED", `Overlast eq '0.0.0 ' and substringof('BU${GM}',WijkenEnBuurten) and Perioden eq '2025JJ00'`, "WijkenEnBuurten,GeregistreerdeOverlast_1");
// Meer dan 10.000 rijen geeft HTTP 500 (geen odata.nextLink): vraag daarom per soort op (Amsterdam: 517 buurten x 12 maanden).
const miB = [];
for (const soort of ["0.0.0 ", "1.1.1 "])
  miB.push(...await politie("47022NED", `SoortMisdrijf eq '${soort}' and substringof('BU${GM}',WijkenEnBuurten) and substringof('2025MM',Perioden)`, "WijkenEnBuurten,SoortMisdrijf,GeregistreerdeMisdrijven_1"));
for (const r of ovB) if (buurt[r.WijkenEnBuurten]) buurt[r.WijkenEnBuurten].overlast += r.GeregistreerdeOverlast_1 ?? 0;
for (const r of miB) if (buurt[r.WijkenEnBuurten]) buurt[r.WijkenEnBuurten][r.SoortMisdrijf === "0.0.0 " ? "misdrijf" : "inbraak"] += r.GeregistreerdeMisdrijven_1 ?? 0;
console.log(`\nOverlast 2025: ${som(ovB, "GeregistreerdeOverlast_1")} bij een buurt, ${som(ov.filter((r) => r.Perioden === "2025JJ00"), "GeregistreerdeOverlast_1")} bij de gemeente (rest zonder buurt)`);

const telbaar = Object.entries(buurt).filter(([, b]) => (b.inw ?? 0) >= 1000); // kleine buurten schieten alle kanten op
const rij = ([c, b]) => `  ${c}  ${(b.naam ?? "?").slice(0, 27).padEnd(27)} ${String(b.inw).padStart(6)} inw | misdr. ${per1000(b.misdrijf, b.inw).padStart(6)} overlast ${per1000(b.overlast, b.inw).padStart(5)} | inbraak/1.000 won. ${per1000(b.inbraak, b.won).padStart(4)}`;
console.log(`\nMeeste misdrijven per 1.000 inwoners in 2025 (${telbaar.length} buurten met minstens 1.000 inwoners):`);
telbaar.sort((a, b) => b[1].misdrijf / b[1].inw - a[1].misdrijf / a[1].inw).slice(0, 6).forEach((x) => console.log(rij(x)));
console.log("Meeste woninginbraken per 1.000 woningen in 2025:");
telbaar.sort((a, b) => b[1].inbraak / b[1].won - a[1].inbraak / a[1].won).slice(0, 3).forEach((x) => console.log(rij(x)));
const mediaan = (xs) => { const s = [...xs].sort((a, b) => a - b); return s[Math.floor(s.length / 2)]; };
console.log(`Mediaan buurt: ${mediaan(telbaar.map(([, b]) => b.misdrijf / b.inw * 1000)).toFixed(1)} misdrijven en ${mediaan(telbaar.map(([, b]) => b.overlast / b.inw * 1000)).toFixed(1)} overlastmeldingen per 1.000 inwoners`);
Utrecht (GM0344): 111 buurten, 376.770 inwoners en 168.736 woningen (kerncijfers 2025), 111 grenzen gekoppeld

Jaar  overlast  misdrijven  woninginbraak | per 1.000 inw: overlast misdr. | inbraak per 1.000 woningen
2021     21096       21765            681 |                56.0   57.8 |   4.0
2022     16342       24093            666 |                43.4   63.9 |   3.9
2023     15602       25437            513 |                41.4   67.5 |   3.0
2024     15478       25124            399 |                41.1   66.7 |   2.4
2025     18181       27512            629 |                48.3   73.0 |   3.7

Overlast 2025: 17974 bij een buurt, 18181 bij de gemeente (rest zonder buurt)

Meeste misdrijven per 1.000 inwoners in 2025 (95 buurten met minstens 1.000 inwoners):
  BU03440613  Hoog-Catharijne NS en Jaarb   2935 inw | misdr. 1252.1 overlast 607.8 | inbraak/1.000 won.  0.8
  BU03440612  Lange Elisabethstraat, Mari   1790 inw | misdr.  539.7 overlast 346.9 | inbraak/1.000 won.  4.9
  BU03440621  Wijk C                        1370 inw | misdr.  516.1 overlast 365.7 | inbraak/1.000 won.  3.5
  BU03440611  Domplein, Neude, Janskerkho   2515 inw | misdr.  368.6 overlast 371.8 | inbraak/1.000 won.  3.7
  BU03440623  Nobelstraat en omgeving       1000 inw | misdr.  258.0 overlast 160.0 | inbraak/1.000 won.  7.3
  BU03440535  Galgenwaard en omgeving       1205 inw | misdr.  205.8 overlast  13.3 | inbraak/1.000 won. 10.5
Meeste woninginbraken per 1.000 woningen in 2025:
  BU03440113  Halve Maan-Zuid               1485 inw | misdr.   53.9 overlast  37.0 | inbraak/1.000 won. 15.1
  BU03440626  Nieuwegracht-Oost             1160 inw | misdr.  169.0 overlast 190.5 | inbraak/1.000 won. 14.4
  BU03440535  Galgenwaard en omgeving       1205 inw | misdr.  205.8 overlast  13.3 | inbraak/1.000 won. 10.5
Mediaan buurt: 50.8 misdrijven en 35.2 overlastmeldingen per 1.000 inwoners
Where it goes wrong
- Padding in the police tables: '0.0.0 ', '1.1.1 ', 'GM0344 ' (10 characters), 'NL00 '. Without the spaces you get an empty list and no error. In the key figures at datasets.cbs.nl (OData v4) there is no padding at all.
- More than 10,000 rows in one query gives HTTP 500 ('Please redefine your query so that it returns less than 10000 records'), not a next page. For large municipalities, query per type or per year. Amsterdam with two types and twelve months is already 12,408 rows.
- Per resident is misleading in city centre and station areas: Hoog-Catharijne NS en Jaarbeurs has 2,935 residents but 3,675 crimes in 2025 (1,252 per 1,000). Travellers, shoppers and people going out count in the numerator, not in the denominator. Explain that rather than making a 'most dangerous neighbourhoods' ranking.
- Small numbers swing hard. Halve Maan-Zuid has Utrecht's highest burglary rate (15.1 per 1,000 homes), but that is only 9 burglaries. For neighbourhoods under 1,000 residents or with fewer than 20 cases, show 'too small' instead of a rate.
- Series break in March 2021: since then the police record nuisance differently, especially 'confused person'. Start trend lines in 2021 or later. The police also revise old months, so reload the full series at every refresh.
- The PDOK WFS (MapServer) silently ignores cql_filter and then sends the first 1,000 neighbourhoods of the whole country (49 MB). Use an FES filter (XML in the filter parameter). And take the 2025 service: all police figures use the 2025 neighbourhood boundaries.
- The crime table has no yearly totals (months only), the nuisance table does (2025JJ00). And about 1% of nuisance reports is assigned to the municipality but to no neighbourhood: Utrecht 2025 18,181 against 17,974.
- A registration is not an incident. How often people report differs per neighbourhood and per type; many bicycle thefts are never reported. Say so next to every chart.
Take it further
- Monthly alert: a new month appears around the 15th. Compare January up to the newest month with the same months last year and send a message when a neighbourhood with enough reports rises by more than 30%.
- Pick a type: bicycle theft (1.2.3), street robbery (1.4.6), confused person (E33) or youth nuisance (E35) as its own map layer, with a monthly seasonal pattern.
- Compare neighbourhoods with income and liveability: average income is also in the 2025 key figures, the Leefbaarometer has a score per neighbourhood (layer buurtscore24). Show the relationship, but say that correlation is not causation.
- Aggregate to districts (WK) for a calmer picture: add neighbourhoods up per district, or query the district codes directly (WK034401, padded to 10 characters).
More with this data
Recorded crimes: 45.0 per 1,000 inhabitants in 2025, 3.2 times as much as in 1948
Recorded crimes, 1948 – 2025, per 1,000 inhabitants. The highest point was 2001 (93.0).
The sources4

Registered nuisance by neighbourhoodIn depth
Every month the police count how many nuisance reports came in, per neighbourhood and per type: from confused persons and youth to noise and drugs. Statistics Netherlands (CBS) publishes the figures as an open table, one month after the fact.
Registered crime by neighbourhood
All crimes recorded by the police, in 59 categories, per neighbourhood and month. From bicycle theft to burglary.

Key figures for districts and neighbourhoods
Over a hundred figures per neighbourhood: residents by age, households, property values, income, benefits, cars and distance to amenities. A new table every year.

District and neighbourhood map
The official boundaries of all municipalities, districts and neighbourhoods, as a map service (WFS) and download. The geometry you need to map neighbourhood figures.
More to build
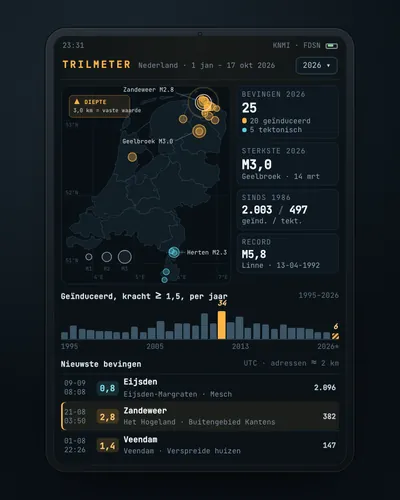 Earthquake tracker: every quake on the map, with municipality and homesMap
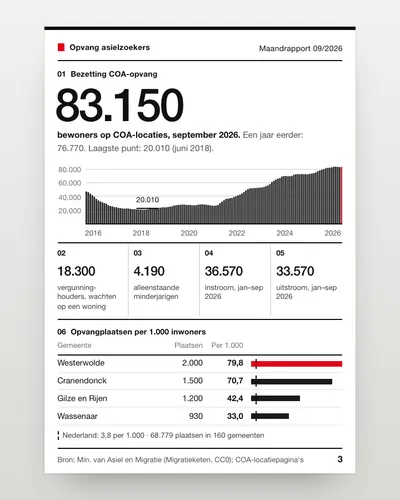 Asylum reception dashboard: national and per municipalityDashboard
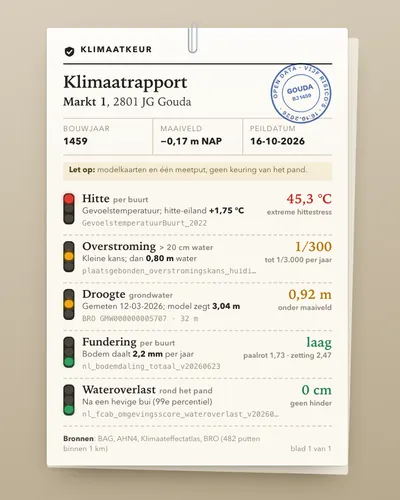 Climate risk check for an addressTool
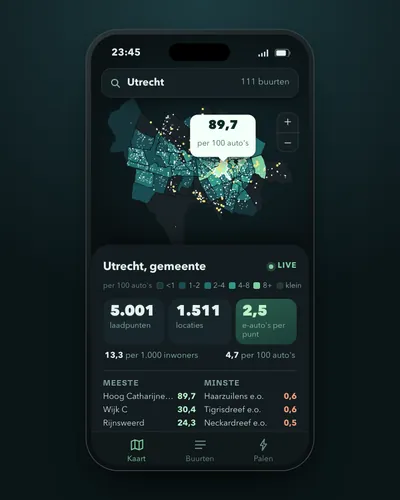 Charging points per neighbourhood and per electric carMap
 Wildfire map: today's risk, hotspots and burnt landMap
 Satellite before and after: see how your town or polder changedTool