Charging points per neighbourhood and per electric car
A map of your municipality showing, per neighbourhood, how many public charging points there are, per 1,000 residents and per 100 cars, and how many electric cars depend on one charging point.
geef_project("laadpalen-per-buurt")geef_bron("ndw-verkeer")geef_bron("pdok-wijkenbuurten")geef_bron("cbs-kwb")
I have the project, the tested calls and the pitfalls. I'll build a map with NDW live traffic data, District and neighbourhood map, Key figures for districts and neighbourhoods and RDW registered vehicles. This is how it could look:
You build this yourself. Copy the prompt into Claude, ChatGPT or Cursor, with the MCP server on, or follow the steps below.
Most
Fewest
This is a mockup, not a working version, with the figures from our test run on 16 October 2026, 23:45; the map shows the 2025 neighbourhood boundaries and the 1,512 charging locations from the NDW file of 17 October 2026, 23:33. Turn the MCP server on with the address on For AI.
Who it's for
Council members and policy makers following the roll-out of charging points, residents who want to know whether their neighbourhood lags behind, and data journalists.
What you get
A map of one municipality with, per neighbourhood, the charging points per 100 private cars (coloured areas), the charging locations as dots, and a table per neighbourhood with locations, charging points, residents, cars and the ratio. At the top the municipal total and the number of electric cars per charging point.
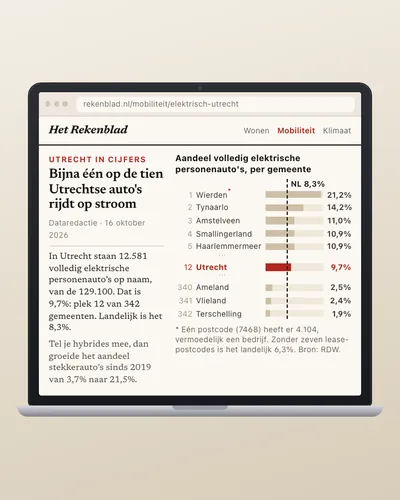
Test run for Utrecht on 16 October 2026: the NDW file had 80,583 charging locations, 80,553 with usable coordinates in the Netherlands. The 111 Utrecht neighbourhoods (2025 boundaries) had 1,511 locations with 5,001 charging points: 13.3 per 1,000 residents and 4.7 per 100 private cars (CBS key figures 2025). The 47 Utrecht postcodes had 12,581 fully electric passenger cars registered (RDW): 2.5 per public charging point. Hoog Catharijne and Jaarbeurs came out at 89.7 charging points per 100 cars (parking garages), Neckardreef area at 0.5. Two neighbourhoods had no charging point at all.
Public EV charging locations by operator: most Vattenfall InCharge (22,217 charging locations), then EQUANS and TotalEnergies
Public EV charging locations by operator, October 2026, in charging locations. Total: 80,852; the largest 12 of 123 categories are shown. Vattenfall InCharge is 27% of the total. Each charging location counts once, even with several charge points. Operator as reported by NDW.
How you could start6 steps
- 1
Fetch all public charging locations
NDW collects the charging points that operators report via OCPI. The GeoJSON file (4.9 MB gzip) is refreshed every minute and has per location the operator and per connector type the number (total), the number free (available) and the maximum power in watts. There is also a full OCPI file (17 MB) with addresses and postcodes. Note: 30 locations drop out: 8 are in Belgium or Austria and 22 Dutch ones have impossible coordinates, such as (0, 0), (135, 90) or a point in the United States. And a fast charger with both CCS and CHAdeMO appears twice, once per connector type.
https://opendata.ndw.nu/charging_point_locations.geojson.gz
{"features":[{"id":"NL-GFX-3F847574-0E5F-49B5-9DC2-148ECF027E29","type":"Feature", "geometry":{"type":"Point","coordinates":[4.621773,52.386765]}, "properties":{"open":false,"cpo_id":"GFX","address":"2 Delfstraat","country":"NLD", "owner_name":"TotalEnergies","last_updated":"2026-10-16T18:15:15Z","operator_name":"TotalEnergies", "availabilities":[{"total":2,"available":0,"power_max":13000.0,"power_type":"AC3", "tariff_ids":[],"connector_type":"IEC_62196_T2","connector_format":"SOCKET"}],"suboperator_name":null}}, … - 2
Fetch your municipality's neighbourhood boundaries
The PDOK OGC API returns the district and neighbourhood map as GeoJSON in longitude and latitude (the OGC API default), so it fits a web map. For 2025 you can filter on gemeentecode; 111 Utrecht neighbourhoods are 559 kB. The 2026 map (version 0) has different field names (bu_code, wk_code) and no municipality filter: use the same year for boundaries and figures.
https://api.pdok.nl/cbs/wijken-en-buurten-2025/ogc/v1/collections/buurten/items?f=json&gemeentecode=GM0344&limit=1000
{"type": "Feature", "properties": {"buurtcode": "BU03440111", "buurtnaam": "Welgelegen, Den Hommel", "gemeentecode": "GM0344", "aantal_inwoners": 1880, "meest_voorkomende_postcode": "3533", "jaar": 2025, …}, "geometry": {"type": "MultiPolygon", "coordinates": [[[[5.095491321284598, 52.086681739377646], …]]]}, …} (numberReturned: 111) - 3
Put every charging point in a neighbourhood
With a point-in-polygon test (ray casting) you find each location's neighbourhood. Handle MultiPolygons and holes. Per location take the largest 'total' over the connector types, not the sum, or you double-count fast chargers. Nationally that is 200,063 versus 203,205 charging points. For the whole country (14,000 neighbourhoods, 80,000 points) a spatial index (rbush, Turf, or PostGIS) is faster.
- 4
Fetch residents and cars per neighbourhood
The 2025 neighbourhood key figures (CBS 86165NED) have per neighbourhood the number of residents, the number of privately owned passenger cars and the most common postcode. There is no count of electric cars per neighbourhood. Field names end in a sequence number that shifts per edition (in 2026, table 86358NED, it is PersonenautoSParticulieren_105). CBS returned 500 or 503 a few times on 16 October: retry after a minute.
https://opendata.cbs.nl/ODataApi/OData/86165NED/TypedDataSet?$format=json&$filter=substringof('BU0344',WijkenEnBuurten)&$select=WijkenEnBuurten,AantalInwoners_5,PersonenautoSParticulieren_104&$top=3
{ "odata.metadata":"https://opendata.cbs.nl/ODataApi/OData/86165NED/$metadata#Cbs.OData.WebAPI.TypedDataSet&$select=WijkenEnBuurten,AantalInwoners_5,PersonenautoSParticulieren_104","value":[ { "WijkenEnBuurten":"BU03440111","AantalInwoners_5":1880,"PersonenautoSParticulieren_104":452 },{ "WijkenEnBuurten":"BU03440112","AantalInwoners_5":4105,"PersonenautoSParticulieren_104":1214 }, … - 5
Count electric cars per postcode
The RDW table Brandstoffen_op_PC4 counts vehicles per four-digit postcode, vehicle type and fuel (E = fully electric, BE = petrol hybrid). The address is the keeper's, so companies too: postcode 3511 (Utrecht centre) has 1,817 electric cars, its neighbours 3512 and 3513 together 217. Nationally, 223,943 of the 798,322 electric passenger cars are registered at seven postcodes with more than 20,000 cars each (probably leasing and rental). So a fair figure per neighbourhood is not possible; per municipality or postcode it is, with that caveat.
https://opendata.rdw.nl/resource/8wbe-pu7d.json?$select=postcode,sum(aantal)&$where=voertuigsoort='Personenauto' AND brandstof='E' AND postcode in(3511,3512,3513)&$group=postcode
[{"postcode":"3511","sum_aantal":"1817"} ,{"postcode":"3512","sum_aantal":"135"} ,{"postcode":"3513","sum_aantal":"82"}] - 6
Compute the ratios and draw the map
Per neighbourhood: charging points per 1,000 residents and per 100 private cars. Grey out neighbourhoods with fewer than 200 cars (too small). Per municipality: electric cars per charging point. Draw the neighbourhood areas with a colour scale and the charging locations as dots, each showing operator, number of points and power.
How the sources fit together
- NDW live traffic dataDistrict and neighbourhood mapvia
coördinaten van de laadlocatie in de buurtgrens (punt-in-polygoon)NDW has no neighbourhood code; the position decides which neighbourhood a charging location is in.
- District and neighbourhood mapKey figures for districts and neighbourhoodsvia
buurtcode (BU03440111), zelfde jaargangBoundaries and key figures from the same year (2025) join on neighbourhood code. Codes change when areas are redrawn.
- Key figures for districts and neighbourhoodsRDW registered vehiclesvia
meest voorkomende postcode per buurt (MeestVoorkomendePostcode_118) = postcode in Brandstoffen_op_PC4RDW counts per postcode, CBS per neighbourhood. Via the most common postcode per neighbourhood you collect a municipality's postcodes; a postcode can span several neighbourhoods, so it is not an exact split per neighbourhood.
Let AI build it
Paste this prompt into Claude, ChatGPT, Cursor or Lovable. It names the real endpoints, the join keys and the pitfalls, so the assistant writes working code straight away. Always check the result against the source itself.
Build a map (one HTML page with MapLibre GL or Leaflet, data prepared with a Node 20 script) that shows, for one municipality, how many public charging points each neighbourhood has.

Data, all open and without a key:
- Charging points (NDW, every minute): https://opendata.ndw.nu/charging_point_locations.geojson.gz (4.9 MB gzip, GeoJSON in WGS84).
- Neighbourhood boundaries 2025 (PDOK OGC API): https://api.pdok.nl/cbs/wijken-en-buurten-2025/ogc/v1/collections/buurten/items?f=json&gemeentecode=GM0344&limit=1000
- Residents and cars per neighbourhood (CBS 86165NED, OData v3): https://opendata.cbs.nl/ODataApi/OData/86165NED/TypedDataSet?$format=json&$filter=substringof('BU0344',WijkenEnBuurten)&$select=WijkenEnBuurten,AantalInwoners_5,PersonenautoSParticulieren_104,MeestVoorkomendePostcode_118
- Electric cars per postcode (RDW, Socrata SoQL): https://opendata.rdw.nl/resource/8wbe-pu7d.json?$select=postcode,sum(aantal)&$where=voertuigsoort='Personenauto' AND brandstof='E' AND postcode in(…)&$group=postcode

What you need to know:
- NDW: charging points per location = the largest availabilities[].total, not the sum (a fast charger with CCS and CHAdeMO appears twice). Drop points outside the Netherlands (some are at (0, 0), (135, 90) or in the United States). country 'NLD'.
- PDOK 2025: geometry is MultiPolygon in longitude/latitude. Use a real point-in-polygon test (Turf booleanPointInPolygon or your own ray casting) and respect holes.
- PDOK 2026 has different field names and no municipality filter: keep boundaries and figures in the same year.
- CBS: field names end in a sequence number that changes per edition. Read them from /DataProperties. Codes in WijkenEnBuurten are ten characters here, without padding. -99997 and null = confidential or unknown. CBS can return 500/503: retry with a delay.
- RDW: the postcode is the keeper's address, including leasing and rental companies (postcode 1114 has 59,943 electric cars). So no electric cars per neighbourhood; give 'electric cars per charging point' per municipality with a clear caveat.
- Neighbourhoods with fewer than 200 private cars: grey, 'too small'.

Output: a choropleth of the neighbourhoods (charging points per 100 private cars, 5 classes), dots for the charging locations with a popup (operator, points, power in kW), a side panel with the municipal total (charging points, per 1,000 residents, electric cars per charging point) and a sortable table per neighbourhood. A drop-down for the municipality (GM code) and a line with the reference dates: NDW (Last-Modified), boundaries 2025, CBS key figures 2025, RDW (today's date).
Try it yourself
The core of the project in a small script. Needs: Node 20+ (fetch en zlib ingebouwd), geen pakketten. Tested on 2026-10-16; below is the real output of that run.
// Laadpunten per buurt en per elektrische auto, voor één gemeente. Node 20+, geen pakketten nodig.
// Bronnen: NDW (laadpunten), PDOK (buurtgrenzen 2025), CBS kerncijfers wijken en buurten 2025 (86165NED), RDW (auto's per postcode).
import zlib from "node:zlib";
const UA = { "User-Agent": "mijn-laadkaart/1.0 (+jij@voorbeeld.nl)" };
const GM = "0344";   // Utrecht; vul je eigen gemeentecode in (4 cijfers)
const haal = async (url) => { const r = await fetch(url, { headers: UA }); if (!r.ok) throw new Error(`${r.status} ${url}`); return r; };

// 1. Buurtgrenzen 2025 van PDOK (GeoJSON in lengte/breedte)
const buurten = (await (await haal(`https://api.pdok.nl/cbs/wijken-en-buurten-2025/ogc/v1/collections/buurten/items?f=json&gemeentecode=GM${GM}&limit=1000`)).json()).features;

// 2. Alle laadlocaties van NDW (4,9 MB gzip, elke minuut nieuw)
const ndw = JSON.parse(zlib.gunzipSync(Buffer.from(await (await haal("https://opendata.ndw.nu/charging_point_locations.geojson.gz")).arrayBuffer())));
const inNL = ([x, y]) => x > 3.2 && x < 7.3 && y > 50.7 && y < 53.6;   // er staan punten op (0,0) en ver buiten Nederland in
const locaties = ndw.features.filter((f) => f.properties.country === "NLD" && inNL(f.geometry.coordinates));
// Laadpunten per locatie: het grootste 'total' over de connectortypes. Een snellader met CCS én CHAdeMO is één punt, geen twee.
const punten = (f) => Math.max(0, ...(f.properties.availabilities ?? []).map((a) => a.total));

// 3. Punt-in-polygoon (straal-methode), werkt voor Polygon en MultiPolygon
const inRing = ([x, y], r) => { let in_ = false; for (let i = 0, j = r.length - 1; i < r.length; j = i++) {
  if ((r[i][1] > y) !== (r[j][1] > y) && x < ((r[j][0] - r[i][0]) * (y - r[i][1])) / (r[j][1] - r[i][1]) + r[i][0]) in_ = !in_; } return in_; };
const inVlak = (p, g) => (g.type === "Polygon" ? [g.coordinates] : g.coordinates).some((poly) => inRing(p, poly[0]) && !poly.slice(1).some((gat) => inRing(p, gat)));
const per = new Map(buurten.map((b) => [b.properties.buurtcode, { naam: b.properties.buurtnaam, locaties: 0, punten: 0 }]));
for (const f of locaties) { const b = buurten.find((b) => inVlak(f.geometry.coordinates, b.geometry));
  if (b) { const t = per.get(b.properties.buurtcode); t.locaties++; t.punten += punten(f); } }

// 4. Inwoners en particuliere auto's per buurt (CBS, kerncijfers 2025)
const cbs = (await (await haal(`https://opendata.cbs.nl/ODataApi/OData/86165NED/TypedDataSet?$format=json&$filter=substringof('BU${GM}',WijkenEnBuurten)&$select=WijkenEnBuurten,AantalInwoners_5,PersonenautoSParticulieren_104,MeestVoorkomendePostcode_118`)).json()).value;
for (const r of cbs) { const t = per.get(r.WijkenEnBuurten.trim()); if (t) Object.assign(t, { inwoners: r.AantalInwoners_5, autos: r.PersonenautoSParticulieren_104, pc4: r.MeestVoorkomendePostcode_118?.trim() }); }

// 5. Elektrische personenauto's per postcode (RDW, adres van de houder). Postcodes = de meest voorkomende per buurt.
const pc4s = [...new Set([...per.values()].map((t) => t.pc4).filter(Boolean))];
const rdw = await (await haal(`https://opendata.rdw.nl/resource/8wbe-pu7d.json?$select=postcode,sum(aantal)&$where=voertuigsoort='Personenauto' AND brandstof='E' AND postcode in(${pc4s.join(",")})&$group=postcode&$limit=5000`)).json();
const ev = rdw.reduce((s, r) => s + Number(r.sum_aantal), 0);

const rijen = [...per.entries()].map(([code, t]) => ({ code, ...t }));
const tot = rijen.reduce((s, t) => ({ loc: s.loc + t.locaties, p: s.p + t.punten, inw: s.inw + (t.inwoners ?? 0), a: s.a + (t.autos ?? 0) }), { loc: 0, p: 0, inw: 0, a: 0 });
console.log(`NDW-bestand: ${ndw.features.length} locaties, ${locaties.length} bruikbaar in Nederland`);
console.log(`Gemeente GM${GM}: ${buurten.length} buurten, ${tot.loc} laadlocaties met ${tot.p} laadpunten`);
console.log(`  ${(tot.p / tot.inw * 1000).toFixed(1)} laadpunten per 1.000 inwoners, ${(tot.p / tot.a * 100).toFixed(1)} per 100 particuliere auto's`);
console.log(`  ${ev} elektrische personenauto's in ${pc4s.length} postcodes (RDW): ${(ev / tot.p).toFixed(1)} per laadpunt`);
const groot = rijen.filter((t) => t.autos >= 200).map((t) => ({ ...t, r: t.punten / t.autos * 100 })).sort((a, b) => b.r - a.r);
const regel = (t) => `  ${t.code} ${t.naam.slice(0, 30).padEnd(30)} ${String(t.punten).padStart(4)} punten, ${String(t.autos).padStart(5)} auto's: ${t.r.toFixed(1)} per 100`;
console.log("Meeste laadpunten per 100 particuliere auto's (buurten met 200+ auto's):"); groot.slice(0, 5).forEach((t) => console.log(regel(t)));
console.log("Minste:"); groot.slice(-5).forEach((t) => console.log(regel(t)));
console.log(`Buurten zonder enig laadpunt: ${rijen.filter((t) => t.punten === 0).length}`);
NDW-bestand: 80583 locaties, 80553 bruikbaar in Nederland
Gemeente GM0344: 111 buurten, 1511 laadlocaties met 5001 laadpunten
  13.3 laadpunten per 1.000 inwoners, 4.7 per 100 particuliere auto's
  12581 elektrische personenauto's in 47 postcodes (RDW): 2.5 per laadpunt
Meeste laadpunten per 100 particuliere auto's (buurten met 200+ auto's):
  BU03440613 Hoog-Catharijne NS en Jaarbeur  392 punten,   437 auto's: 89.7 per 100
  BU03440621 Wijk C                           65 punten,   214 auto's: 30.4 per 100
  BU03440534 Rijnsweerd                      197 punten,   811 auto's: 24.3 per 100
  BU03440132 Schepenbuurt, Cartesiusweg e.o   66 punten,   502 auto's: 13.1 per 100
  BU03440121 Lombok-Oost                      50 punten,   381 auto's: 13.1 per 100
Minste:
  BU03440332 Vechtzoom-noord, Klopvaart       11 punten,  1162 auto's: 0.9 per 100
  BU03440221 Nijenoord, Hoogstraat en omgev    4 punten,   561 auto's: 0.7 per 100
  BU03441012 Haarzuilens en omgeving           2 punten,   312 auto's: 0.6 per 100
  BU03440342 Tigrisdreef en omgeving           8 punten,  1380 auto's: 0.6 per 100
  BU03440322 Neckardreef en omgeving           6 punten,  1217 auto's: 0.5 per 100
Buurten zonder enig laadpunt: 2
Where it goes wrong
- Double counting at fast chargers. availabilities has one row per connector type; a post with CCS and CHAdeMO is one charging point. Take the maximum per location: 200,063 charging points nationally, against 203,205 if you add them up.
- Odd coordinates. 22 Dutch locations had coordinates like (0, 0), (135, 90) or in the United States, France and India; the file also held 7 Belgian and 1 Austrian location. Filter on country and a box around the Netherlands.
- Parking garages skew the average. Hoog Catharijne and Jaarbeurs has 392 charging points for 437 private cars: those are garages for visitors. So also show the number of locations and let readers see which neighbourhoods have garages.
- Company cars are registered at the company address. The RDW postcode file counts lease and company cars at the keeper's address. 'Electric cars per charging point' per municipality is therefore an approximation; say so.
- Public charging points only. The NDW file has what operators report via OCPI: public posts and semi-public ones (garages, business sites). Home chargers on private driveways are not in it. A neighbourhood with many driveways therefore looks underserved.
- Mixing editions. 2025 boundaries with 2026 figures seem to fit, but neighbourhood codes and boundaries change. Keep both in the same year.
Take it further
- The whole country: run it for all 342 municipalities with a spatial index (or PostGIS) and rank municipalities on charging points per 100 cars.
- Track growth: store the NDW file weekly (only id, position and number of points) and show per neighbourhood how many charging points are added per month.
- Occupancy: available says how many points are free now. Read the file every 15 minutes for a week and compute per neighbourhood how often all posts are occupied.
- Add income: link the neighbourhoods to average income from the key figures and see whether lower-income neighbourhoods have fewer charging points.
More with this data
Public charging locations by highest charging power: 11 kW or less is the largest part, 63% in October 2026
Breakdown in October 2026: 11 kW or less 63%, between 11 and 22 kW 35%, more than 150 kW 0.9%, between 50 and 150 kW 0.6%, between 22 and 50 kW 0.6%. Total: 80,851 charging locations.
The sources4

NDW live traffic data
Speeds and volumes from tens of thousands of road sensors, refreshed every minute. Also roadworks and incidents.

District and neighbourhood map
The official boundaries of all municipalities, districts and neighbourhoods, as a map service (WFS) and download. The geometry you need to map neighbourhood figures.

Key figures for districts and neighbourhoods
Over a hundred figures per neighbourhood: residents by age, households, property values, income, benefits, cars and distance to amenities. A new table every year.

RDW registered vehicles
Data on every Dutch licence plate: make, model, fuel, weight and inspection expiry. No personal data.
More to build
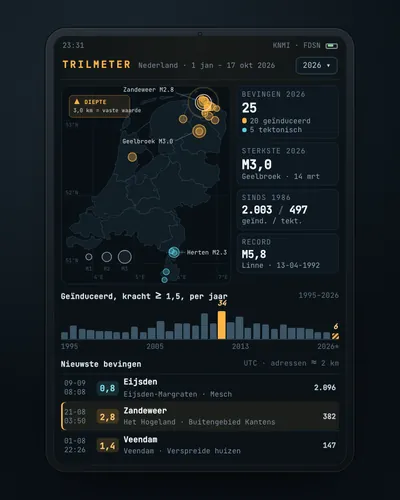 Earthquake tracker: every quake on the map, with municipality and homesMap
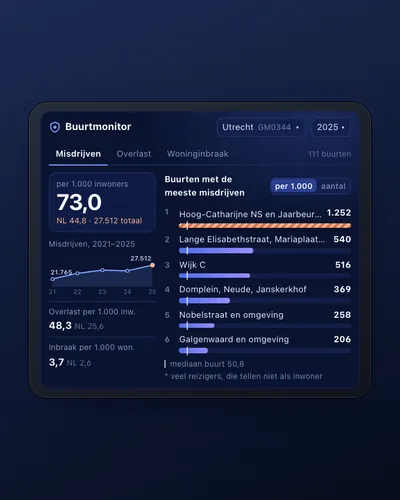 Neighbourhood safety monitor: nuisance and crime per neighbourhoodDashboard
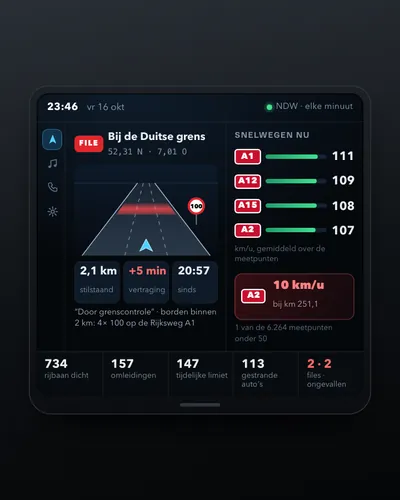 Dashboard of traffic jams, speeds and roadworksDashboard
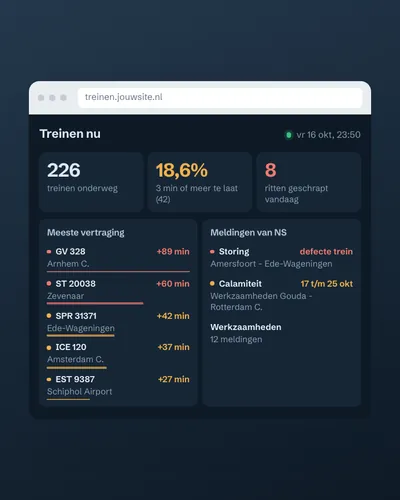 Train delay and disruption dashboardDashboard
 How fast is your municipality going electric?Analysis
 Live map of buses, trams and metrosMap