Housing market dashboard for your municipality
One page per municipality with sale prices, WOZ value, housing stock, construction years, dwelling size and liveability, next to the national average. All from open APIs without a key.
geef_project("woningmarkt-dashboard")geef_bron("cbs-statline")geef_bron("pdok-bag")geef_bron("leefbaarometer")
I have the project, the tested calls and the pitfalls. I'll build a dashboard with CBS StatLine, Addresses and Buildings Register (BAG) and Leefbaarometer liveability index. This is how it could look:
You build this yourself. Copy the prompt into Claude, ChatGPT or Cursor, with the MCP server on, or follow the steps below.
Average sale price
DelftNetherlandsDelft is more than twice as expensive as in 2015.
Year built
BAG · Oct 2026 · 54,862- pre-194521.4%
- 1945–7431.0%
- 1975–9425.0%
- 1995–1412.4%
- 2015+10.3%
This is a mockup, not a working version, with the figures for Delft from our test run on 16 October 2026 and the CBS price series 1995–2025, fetched on 17 October 2026. Turn the MCP server on with the address on For AI.
Who it's for
Council members preparing the housing debate, local journalists, estate agents and buyers comparing municipalities, and students who want to build a first dashboard with real government data.
What you get
A dashboard that shows at a glance how the housing market of one municipality is doing. Test run for Delft (GM0503) on 16 October 2026: - Average sale price of an existing owner-occupied home in 2025: 453,866 euros, against 479,527 euros for the Netherlands as a whole. In 2015 it was 211,971 euros in Delft, so more than twice as low. Delft ranks 205th of 342 municipalities; Blaricum is the most expensive (1,105,604 euros), Kerkrade the cheapest (270,119 euros). - Average WOZ (property tax) value on 1 January 2026: 393,000 euros (provisional), a year earlier 352,000 euros. Nationally 439,000 euros. In 2025: owner-occupied 488,000, housing association 249,000, other rentals 311,000 euros. - Housing stock on 1 January 2026: 54,777 dwellings, 3,282 more than on 1 January 2021 (51,495). Average floor area 88 m², nationally 120 m². - BAG, October 2026: 54,862 dwellings in use in the place Delft. 52.4% was built before 1975 (21.4% before 1945), 10.3% in 2015 or later. 43.9% is smaller than 75 m². - Leefbaarometer 2024: score 4.052, class 6 of 9, 318th of 342 municipalities. The housing stock sub-score (-0.049) pulls it down the most. The script fetches all of this in about 17 seconds; the BAG counts take most of the time.
Average sale price of an existing home: 505 thousand euros in September 2026, 5.7 times as much as in January 1995
Average sale price of an existing home, January 1995 – September 2026, in thousand euros. That is the highest point in the series.
How you could start7 steps
- 1
Find the right CBS tables in the catalogue
The CBS catalogue lists every table with title, period and modification date. Filter on a word in the title and exclude discontinued tables: there are dozens of old housing tables (price index 2010=100, 2015=100) that are no longer updated. For this dashboard you need three tables per municipality: 83625NED (average sale prices, 1995 to 2025), 85036NED (average WOZ value by ownership, from 2019) and 85035NED (housing stock and average floor area on 1 January, from 2021). Note: the regional price index (85792NED) only has the four largest cities as municipalities.
https://opendata.cbs.nl/ODataCatalog/Tables?$format=json&$filter=substringof('koopwoningen',Title) and Frequency ne 'Stopgezet'&$select=Identifier,Title,Modified,Period
{"odata.metadata":"https://opendata.cbs.nl/ODataCatalog/$metadata#Tables&$select=Identifier,Title,Modified,Period","value":[ {"Identifier":"85773NED","Title":"Bestaande koopwoningen; verkoopprijzen prijsindex 2020=100","Modified":"2026-09-22T06:30:00","Period":"januari 1995 - augustus 2026"}, {"Identifier":"85792NED","Title":"Bestaande koopwoningen; verkoopprijzen, prijsindex 2020=100, regio","Modified":"2026-07-22T06:30:00","Period":"1e kwartaal 1995 - 2e kwartaal 2026"}, ... {"Identifier":"83625NED","Title":"Bestaande koopwoningen; gemiddelde verkoopprijzen, regio","Modified":"2026-02-17T02:00:00","Period":"1995 t/m 2025"}]} - 2
Fetch the average sale price, municipality and country
We use the newer CBS OData v4 API (datasets.cbs.nl). There, keys have no padding spaces and measures are codes (M001534 = average sale price, in euros; see /MeasureCodes). The Netherlands is NL01. The average sale price is not a price index: if many large houses sell in a year, the average rises even when houses do not get more expensive. CBS says so itself in the table notes. Present it as 'what was paid on average'.
https://datasets.cbs.nl/odata/v1/CBS/83625NED/Observations?$filter=RegioS eq 'GM0503' or RegioS eq 'NL01'&$orderby=Perioden desc&$top=4&$select=RegioS,Perioden,Value
{"@odata.context":"https://datasets.cbs.nl/odata/v1/CBS/83625NED/$metadata#Observations(RegioS,Perioden,Value)","value":[ {"Value":479527.0,"RegioS":"NL01","Perioden":"2025JJ00"}, {"Value":453866.0,"RegioS":"GM0503","Perioden":"2025JJ00"}, {"Value":450985.0,"RegioS":"NL01","Perioden":"2024JJ00"}, {"Value":409999.0,"RegioS":"GM0503","Perioden":"2024JJ00"}]} - 3
Add the WOZ value, with the status of the year
Table 85036NED gives the average WOZ value per 1 January in thousands of euros (393.0 = 393,000 euros). Eigendom T001132 is the total, 1014800 owner-occupied, A047047 housing association, A047048 other landlords. The newest year is provisional: get the status from /PeriodenCodes and show it. According to the table notes the final 2026 figures arrive in early November 2026. The provisional Delft figures only had the total, not yet the split by ownership.
https://datasets.cbs.nl/odata/v1/CBS/85036NED/Observations?$filter=RegioS eq 'GM0503' and Eigendom eq 'T001132'&$orderby=Perioden desc&$top=2&$select=Measure,Eigendom,RegioS,Perioden,Value
{"@odata.context":"https://datasets.cbs.nl/odata/v1/CBS/85036NED/$metadata#Observations(Measure,Eigendom,RegioS,Perioden,Value)","value":[ {"Measure":"M003039","Value":393.0,"Eigendom":"T001132","RegioS":"GM0503","Perioden":"2026JJ00"}, {"Measure":"M003039","Value":352.0,"Eigendom":"T001132","RegioS":"GM0503","Perioden":"2025JJ00"}]} - 4
Count the housing stock and the average floor area
Table 85035NED gives two measures per 1 January in one response: D002936 (housing stock at the start of the year, count) and M002978 (average floor area, m²). Choose Woningtype T001100 and Woningkenmerk T001727 for the total; A053381 gives new builds only, ZW10290 and ZW10340 split single-family and multi-family homes. The series only starts in 2021. Filter on Measure in your code, because both measures are mixed.
https://datasets.cbs.nl/odata/v1/CBS/85035NED/Observations?$filter=RegioS eq 'GM0503' and Woningtype eq 'T001100' and Woningkenmerk eq 'T001727'&$orderby=Perioden desc&$top=2&$select=Measure,RegioS,Perioden,Value
{"@odata.context":"https://datasets.cbs.nl/odata/v1/CBS/85035NED/$metadata#Observations(Measure,RegioS,Perioden,Value)","value":[ {"Measure":"D002936","Value":54777.0,"RegioS":"GM0503","Perioden":"2026JJ00"}, {"Measure":"M002978","Value":88.0,"RegioS":"GM0503","Perioden":"2026JJ00"}]} - 5
Count dwellings by construction year and floor area in the BAG
The PDOK BAG WFS can count without sending data: resultType=hits returns only numberMatched. A dwelling is a unit (verblijfsobject) with 'woonfunctie' in gebruiksdoel (a comma list, so PropertyIsLike) and status 'Verblijfsobject in gebruik'. Add a PropertyIsBetween on bouwjaar or oppervlakte per class. With a filter a count takes 2 to 4 seconds, without one about 30 seconds. The BAG has no municipality code, only places (woonplaatsen): Delft is one place, but many municipalities have several. The five construction-year classes and the five floor-area classes each added up to exactly 54,862.
https://service.pdok.nl/lv/bag/wfs/v2_0?service=WFS&version=2.0.0&request=GetFeature&typeNames=bag:verblijfsobject&resultType=hits&FILTER=<Filter><And><PropertyIsEqualTo><ValueReference>woonplaats</ValueReference><Literal>Delft</Literal></PropertyIsEqualTo><PropertyIsEqualTo><ValueReference>status</ValueReference><Literal>Verblijfsobject in gebruik</Literal></PropertyIsEqualTo><PropertyIsLike wildCard="*" singleChar="." escapeChar="!"><ValueReference>gebruiksdoel</ValueReference><Literal>*woonfunctie*</Literal></PropertyIsLike></And></Filter>
<?xml version='1.0' encoding="UTF-8" ?>
<wfs:FeatureCollection
   xmlns:bag="http://bag.geonovum.nl"
   ...
   timeStamp="2026-10-16T21:39:56" numberMatched="54862" numberReturned="0"
- 6
Fetch the liveability score of every municipality
The Leefbaarometer WFS has a municipality layer per measurement (gemeentescore24 = 2024). Ask only for the fields you need and leave out geom, so the response stays small. The id field is the CBS municipality code, so it joins straight onto the CBS tables. lbm is the score, kscore the class (1 to 9, higher is better), afw the deviation from the national average, won and onv are sub-scores. Fetch all 342 municipalities if you want to show a rank. Use JSON, not CSV: 'Nuenen, Gerwen en Nederwetten' has a comma in its name.
https://geo.leefbaarometer.nl/lbm3/ows?service=WFS&version=2.0.0&request=GetFeature&typeNames=lbm3:gemeentescore24&outputFormat=application/json&propertyName=id,name,lbm,afw,won,onv,kscore&cql_filter=id='GM0503'
{"type":"FeatureCollection","features":[{"type":"Feature","id":"gemeentescore24.fid-6ce20098_1a146a7d447_-7c93","geometry":null, "properties":{"id":"GM0503","name":"Delft","lbm":4.05173106759454,"afw":-0.0505337835491484,"onv":-0.0255306299775484, "won":-0.0491488887163183,"kscore":6},"bbox":[81743,442446.208,87703.775,449847.9507]}], "totalFeatures":1,"numberMatched":1,"numberReturned":1,"timeStamp":"2026-10-16T21:39:44.924Z","crs":null} - 7
Put the municipality next to the rest of the Netherlands
A number only means something next to another number. For the ranking, fetch the sale price of every municipality at once. The region dimension holds all 728 municipality codes that ever existed; in 2025, 342 have a value and the rest are null. Filtering on Value is not allowed (the API returns an error), so drop the empty values in your own code. Municipality names come from /RegioSCodes.
https://datasets.cbs.nl/odata/v1/CBS/83625NED/RegioSCodes?$filter=startswith(Identifier,'GM')&$select=Identifier,Title&$top=3
{"@odata.context":"https://datasets.cbs.nl/odata/v1/CBS/83625NED/$metadata#RegioSCodes(Identifier,Title)","value":[
{"Identifier":"GM1680","Title":"Aa en Hunze"},
{"Identifier":"GM0738","Title":"Aalburg"},
{"Identifier":"GM0358","Title":"Aalsmeer"}]}
How the sources fit together
- CBS StatLineLeefbaarometer liveability indexvia
gemeentecode (GM0503); in de Leefbaarometer het veld idThe Leefbaarometer uses the same CBS codes, so price, WOZ and stock sit next to the liveability score without a lookup table. Both use the municipal boundaries of their own year: after a merger new codes appear.
- CBS StatLineAddresses and Buildings Register (BAG)via
woonplaatsnaam (de BAG-WFS heeft geen gemeentecode)CBS counts the stock from the BAG, so the two should be nearly equal: according to CBS Delft had 54,777 dwellings on 1 January 2026, and according to the BAG WFS 54,862 dwellings were in use in October 2026. A large gap means you are counting the wrong places. CBS also counts dwellings that are out of use or under renovation.
- Addresses and Buildings Register (BAG)Leefbaarometer liveability indexvia
ligging (RD-coördinaten, EPSG:28992)To go below municipality level, BAG objects and Leefbaarometer neighbourhoods and grid cells share the same coordinate system. That lets you put construction years next to the score per neighbourhood.
Let AI build it
Paste this prompt into Claude, ChatGPT, Cursor or Lovable. It names the real endpoints, the join keys and the pitfalls, so the assistant writes working code straight away. Always check the result against the source itself.
Build a housing market dashboard (Next.js or a single HTML file with JavaScript) where I pick a municipality and see: the average sale price over the years, the average WOZ value, the housing stock and average floor area, dwellings by construction year and floor area, and the liveability score. Every figure next to the national average and with the municipality's rank among 342.

Sources (all three open, no key, send an honest User-Agent):
1. CBS OData v4, https://datasets.cbs.nl/odata/v1/CBS/<table>/Observations?$filter=...
   - 83625NED: average sale price of existing owner-occupied homes per year (1995 to 2025), measure M001534, euros.
   - 85036NED: average WOZ value per 1 January, measure M003039, in thousands of euros (393.0 = 393,000 euros). Eigendom: T001132 total, 1014800 owner-occupied, A047047 housing association, A047048 other landlords.
   - 85035NED: housing stock per 1 January (D002936, count) and average floor area (M002978, m²). Woningtype T001100 + Woningkenmerk T001727 = total. Series from 2021.
   - The Netherlands is NL01, municipalities GM + 4 digits. Names: /<table>/RegioSCodes. Status per year (Definitief/Voorlopig): /<table>/PeriodenCodes. Units: /<table>/MeasureCodes.
   - Example: https://datasets.cbs.nl/odata/v1/CBS/83625NED/Observations?$filter=RegioS eq 'GM0503' or RegioS eq 'NL01'
2. BAG via PDOK WFS: https://service.pdok.nl/lv/bag/wfs/v2_0, layer bag:verblijfsobject, with resultType=hits and an FES filter in the FILTER parameter (XML, URL-encoded). Fields: woonplaats, status, gebruiksdoel, bouwjaar, oppervlakte.
3. Leefbaarometer WFS: https://geo.leefbaarometer.nl/lbm3/ows?service=WFS&version=2.0.0&request=GetFeature&typeNames=lbm3:gemeentescore24&outputFormat=application/json&propertyName=id,name,lbm,afw,won,onv,kscore

Pitfalls you must handle:
- The average sale price is not a price index (different houses sold = different average). Call it 'average paid'. The regional price index (85792NED) only has Amsterdam, The Hague, Rotterdam and Utrecht as municipalities.
- The region dimension has 728 municipality codes, including abolished municipalities. Keep only municipalities with a value in the newest year (342 in 2025). Filtering on Value returns an error: do it in your own code.
- The newest WOZ year is provisional (2026, final in early November 2026) and for Delft had no split by ownership yet. Show the status and handle missing categories.
- In 85035NED two measures are mixed in the same list: filter on Measure.
- If you use the old OData v3 (opendata.cbs.nl/ODataApi/OData/<table>/TypedDataSet), keys are padded with spaces to the longest code in that dimension: 'NL01  ' (two spaces) but 'GM0503' without. Without the right spaces you get an empty list and no error. Fields there are GemiddeldeVerkoopprijs_1, GemiddeldeWOZWaardeVanWoningen_1, BeginstandWoningvoorraad_1, GemiddeldeOppervlakte_2. On the evening of 16 October 2026 v3 returned HTTP 503 for a while while v4 worked: build a clean error message or a fallback.
- BAG: a dwelling is a verblijfsobject with 'woonfunctie' in gebruiksdoel. That field is a comma list (for example 'woonfunctie,winkelfunctie'), so use PropertyIsLike with *woonfunctie*, not PropertyIsEqualTo. Use status 'Verblijfsobject in gebruik'.
- The BAG has no municipality code, only places (woonplaatsen). A municipality often has several; add them up. Place names are not always the plain name: 'Bergen (NH)', 'Bergen L', 'Hengelo (Gld)'. Keep a list per municipality or choose the places by hand.
- A BAG count without a filter takes about 30 seconds, with a filter 2 to 4 seconds. Send at most three requests at a time and cache the result for a day.
- GetFeature without resultType=hits always includes geometry and at most 1,000 objects per page: count, don't fetch everything.
- Leefbaarometer: id is the CBS municipality code. Use JSON, not CSV (one municipality name contains a comma). The score is a model estimate for 2024, published in July 2026, every two years.
- Compare the CBS stock (1 January) with the BAG count (today) as a check: they should be within a few percent.

Desired result: a municipality picker, five cards with the figure, the national figure and the rank, a line chart of the sale price since 1995 (municipality and Netherlands), bar charts for construction year and floor area, and under each block the source, table code and reference date. Show a 'provisional' label for provisional figures.
Try it yourself
The core of the project in a small script. Needs: Node 20+ (ingebouwde fetch), opslaan als woningmarkt.mjs en draaien met node woningmarkt.mjs. Tested on 2026-10-16; below is the real output of that run.
// Woningmarkt van één gemeente: verkoopprijs, WOZ-waarde, voorraad (CBS), bouwjaar en oppervlakte (BAG), leefbaarheid.
// Draait met Node 20+ (ingebouwde fetch). Geen sleutels nodig.  node woningmarkt.mjs
const UA = { "User-Agent": "mijn-woningdashboard/1.0 (+jij@voorbeeld.nl)" };
const GM = "GM0503";          // Delft; CBS-gemeentecode
const WOONPLAATS = "Delft";   // BAG kent woonplaatsen, geen gemeenten: kies de woonplaats(en) van jouw gemeente

const CBS = "https://datasets.cbs.nl/odata/v1/CBS";
async function cbs(tabel, filter) {               // OData v4: sleutels zonder opvulspaties
  const url = `${CBS}/${tabel}/Observations?$filter=${encodeURIComponent(filter)}`;
  const r = await fetch(url, { headers: UA });
  if (!r.ok) throw new Error(`${tabel}: HTTP ${r.status}`);
  return (await r.json()).value;
}
async function status(tabel) {                   // per periode: Definitief, Voorlopig of null
  const r = await (await fetch(`${CBS}/${tabel}/PeriodenCodes`, { headers: UA })).json();
  return Object.fromEntries(r.value.map((p) => [p.Identifier.slice(0, 4), p.Status]));
}
const perJaar = (rijen) => Object.fromEntries(rijen.map((r) => [r.Perioden.slice(0, 4), r.Value]));

// 1. Gemiddelde verkoopprijs bestaande koopwoningen (83625NED), gemeente en Nederland
const prijs = perJaar(await cbs("83625NED", `RegioS eq '${GM}'`));
const prijsNL = perJaar(await cbs("83625NED", "RegioS eq 'NL01'"));
// 2. Gemiddelde WOZ-waarde, alle woningen (85036NED, Eigendom T001132 = totaal), in 1.000 euro
const woz = perJaar(await cbs("85036NED", `RegioS eq '${GM}' and Eigendom eq 'T001132'`));
// 3. Woningvoorraad op 1 januari (85035NED): D002936 = aantal, M002978 = gemiddelde oppervlakte
const vr = await cbs("85035NED", `RegioS eq '${GM}' and Woningtype eq 'T001100' and Woningkenmerk eq 'T001727'`);
const voorraad = perJaar(vr.filter((r) => r.Measure === "D002936"));

const wozStatus = await status("85036NED");
const j = Object.keys(prijs).at(-1), jw = Object.keys(woz).at(-1), jv = Object.keys(voorraad).at(-1);
const f = (n) => Math.round(n).toLocaleString("nl-NL");
console.log(`${GM} ${WOONPLAATS}`);
console.log(`Verkoopprijs ${j}: ${f(prijs[j])} euro (Nederland ${f(prijsNL[j])}), 2015: ${f(prijs["2015"])} euro`);
console.log(`WOZ-waarde ${jw}: ${f(woz[jw] * 1000)} euro (${wozStatus[jw].toLowerCase()}), ${jw - 1}: ${f(woz[jw - 1] * 1000)} euro`);
console.log(`Woningvoorraad 1 januari ${jv}: ${f(voorraad[jv])} woningen, 1 januari 2021: ${f(voorraad["2021"])}`);

// 4. BAG: woningen in gebruik naar bouwjaar en oppervlakte, geteld met resultType=hits (alleen een getal terug)
const BAG = "https://service.pdok.nl/lv/bag/wfs/v2_0";
const is = (v, w) => `<PropertyIsEqualTo><ValueReference>${v}</ValueReference><Literal>${w}</Literal></PropertyIsEqualTo>`;
const tussen = (v, a, b) => `<PropertyIsBetween><ValueReference>${v}</ValueReference><LowerBoundary><Literal>${a}</Literal></LowerBoundary><UpperBoundary><Literal>${b}</Literal></UpperBoundary></PropertyIsBetween>`;
const woning = is("woonplaats", WOONPLAATS) + is("status", "Verblijfsobject in gebruik") +
  `<PropertyIsLike wildCard="*" singleChar="." escapeChar="!"><ValueReference>gebruiksdoel</ValueReference><Literal>*woonfunctie*</Literal></PropertyIsLike>`;
async function tel(extra = "") {
  const p = new URLSearchParams({ service: "WFS", version: "2.0.0", request: "GetFeature", typeNames: "bag:verblijfsobject",
    resultType: "hits", FILTER: `<Filter><And>${woning}${extra}</And></Filter>` });
  const t = await (await fetch(`${BAG}?${p}`, { headers: UA })).text();
  return Number(t.match(/numberMatched="(\d+)"/)[1]);
}
async function rustig(taken) { const uit = []; for (let i = 0; i < taken.length; i += 3) uit.push(...await Promise.all(taken.slice(i, i + 3).map((t) => t()))); return uit; }
const BOUWJAAR = [["voor 1945", 0, 1944], ["1945-1974", 1945, 1974], ["1975-1994", 1975, 1994], ["1995-2014", 1995, 2014], ["2015 en later", 2015, 2100]];
const OPP = [["tot 50 m2", 0, 49], ["50-74 m2", 50, 74], ["75-99 m2", 75, 99], ["100-149 m2", 100, 149], ["150 m2 of meer", 150, 1e6]];
const totaal = await tel();
const bj = await rustig(BOUWJAAR.map(([, a, b]) => () => tel(tussen("bouwjaar", a, b))));
const op = await rustig(OPP.map(([, a, b]) => () => tel(tussen("oppervlakte", a, b))));
const pct = (n) => `${(100 * n / totaal).toFixed(1).replace(".", ",")}%`;
console.log(`\nBAG, woningen in gebruik in woonplaats ${WOONPLAATS}: ${f(totaal)}`);
BOUWJAAR.forEach(([k], i) => console.log(`  gebouwd ${k.padEnd(14)} ${f(bj[i]).padStart(7)}  ${pct(bj[i])}`));
OPP.forEach(([k], i) => console.log(`  ${k.padEnd(22)} ${f(op[i]).padStart(7)}  ${pct(op[i])}`));

// 5. Leefbaarometer 2024, alle 342 gemeenten (JSON, niet CSV: sommige namen bevatten een komma)
const q = new URLSearchParams({ service: "WFS", version: "2.0.0", request: "GetFeature", typeNames: "lbm3:gemeentescore24",
  outputFormat: "application/json", propertyName: "id,name,lbm,afw,won,onv,kscore" });
const gem = (await (await fetch(`https://geo.leefbaarometer.nl/lbm3/ows?${q}`, { headers: UA })).json()).features
  .map((x) => x.properties).sort((a, b) => b.lbm - a.lbm);
const i = gem.findIndex((g) => g.id === GM), g = gem[i];
console.log(`\nLeefbaarometer 2024: score ${g.lbm.toFixed(3)}, klasse ${g.kscore} van 9, plek ${i + 1} van ${gem.length}`);
console.log(`  afwijking van het landelijk gemiddelde ${g.afw.toFixed(3)}; deelscores woningvoorraad ${g.won.toFixed(3)}, overlast en onveiligheid ${g.onv.toFixed(3)}`);
GM0503 Delft
Verkoopprijs 2025: 453.866 euro (Nederland 479.527), 2015: 211.971 euro
WOZ-waarde 2026: 393.000 euro (voorlopig), 2025: 352.000 euro
Woningvoorraad 1 januari 2026: 54.777 woningen, 1 januari 2021: 51.495

BAG, woningen in gebruik in woonplaats Delft: 54.862
  gebouwd voor 1945       11.731  21,4%
  gebouwd 1945-1974       17.000  31,0%
  gebouwd 1975-1994       13.706  25,0%
  gebouwd 1995-2014        6.785  12,4%
  gebouwd 2015 en later    5.640  10,3%
  tot 50 m2               10.339  18,8%
  50-74 m2                13.753  25,1%
  75-99 m2                14.436  26,3%
  100-149 m2              12.088  22,0%
  150 m2 of meer           4.246  7,7%

Leefbaarometer 2024: score 4.052, klasse 6 van 9, plek 318 van 342
  afwijking van het landelijk gemiddelde -0.051; deelscores woningvoorraad -0.049, overlast en onveiligheid -0.026
Where it goes wrong
- The average sale price (83625NED) is not a price trend: it is the average of what sold that year. If more large houses sell, it rises without anything getting more expensive. For a real price trend there is the price index (85792NED), but it only has the four largest cities as municipalities.
- CBS region codes: the dimension holds 728 municipality codes, including abolished ones (Aalburg). In 2025, 342 have a value. Filtering on Value is not allowed in the v4 API (error 'The property Value cannot be used in the $filter query option'): drop null values yourself.
- Padding spaces in the old OData v3: keys are padded to the longest code in that dimension. In 83625NED it is 'NL01 ' (two spaces) but 'GM0503' without spaces; with trailing spaces you get an empty list. The v4 API (datasets.cbs.nl) has no padding.
- The newest WOZ year is provisional and may still miss categories: for Delft, 2026 only had the total, not owner-occupied or rental. Read the status from /PeriodenCodes and show it. According to CBS the final 2026 WOZ figures arrive in early November 2026.
- The BAG WFS has no municipality, only places (woonplaatsen), and the names are not always what you expect: 'Bergen (NH)', 'Bergen L', 'Hengelo (Gld)' next to 'Hengelo'. For a municipality with several places, count per place and add up. Always check against the CBS stock (54,777 against 54,862 for Delft).
- gebruiksdoel in the BAG is a comma list: a home above a shop has 'woonfunctie,winkelfunctie'. Count with PropertyIsLike '*woonfunctie*', not with equals, or you miss those homes.
- BAG WFS: without resultType=hits you always get the geometry and at most 1,000 objects per page; GetPropertyValue returns numberMatched 'unknown'. Counting with hits and a filter is much faster (2 to 4 seconds) than fetching everything. Without a filter a count takes about 30 seconds.
- The Leefbaarometer as CSV looks easy, but 'Nuenen, Gerwen en Nederwetten' has a comma in its name and lines end in CRLF. With a naive comma split the columns shift and your ranking goes wrong. Use outputFormat=application/json.
Take it further
- Map of all municipalities: join the 2025 sale price to the PDOK municipal boundaries (pdok-wijkenbuurten) or to the Leefbaarometer layer with geometry, and colour by price or by price divided by WOZ value.
- Per neighbourhood: the Leefbaarometer has buurtscore24 with the CBS neighbourhood code, and you can count the BAG per neighbourhood with a BBOX or Within filter. That shows which neighbourhoods are old and small-built and how they score.
- New-build counter: count BAG buildings with status 'Bouw gestart' or 'Bouwvergunning verleend' per place and put that next to the growth of the CBS stock (Woningkenmerk A053381 = new builds).
- Monthly market: the national monthly price index (85773NED, up to August 2026) as an extra line, with a notification when a new month arrives.
More with this data
Average assessed value of a home: highest in Bloemendaal (900 thousand euro), lowest in Pekela and 1 other municipality (199 thousand euro)
Average assessed value of a home per municipality, 2024, in thousand euro. Netherlands as a whole: 378. 342 municipalities with a figure.
Dwellings in the Netherlands: 8.35 million in 2025, 5.6 times as much as in 1921
Dwellings in the Netherlands, 1921 – 2025, in million. That is the highest point in the series.
Buildings by year of construction (only those standing now): 104,301 buildings in 2025, 3% more than in 2005
Buildings by year of construction (only those standing now), 2005 – 2025, in buildings. The highest point was 2021 (184,232). Figures marked * are provisional.
Liveability score (Leefbaarometer): highest in Vlieland (4.47 points), lowest in Roosendaal (3.97 points)
Liveability score (Leefbaarometer) per municipality, 2024, in points on the Leefbaarometer scale. Netherlands as a whole: 4.10. 342 municipalities with a figure.
The sources3

CBS StatLine
The statistics database of Statistics Netherlands: almost 6,000 tables on population, economy, work, housing, energy, care and more, most with long annual, quarterly or monthly series.

Addresses and Buildings Register (BAG)
Every address and building in the Netherlands with year of construction, floor area and use. The backbone for anything linked at address level.

Leefbaarometer liveability index
An estimate of how pleasant a place is to live, for every inhabited 100 by 100 metre square in the Netherlands, and aggregated per neighbourhood, district, postcode area and municipality. The model uses 45 features of the living environment (94 underlying variables), such as amenities, noise and insecurity. Measurements for 2002 to 2024, with five sub-scores.
More to build
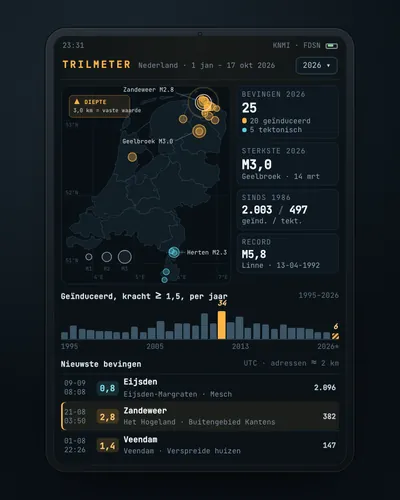 Earthquake tracker: every quake on the map, with municipality and homesMap
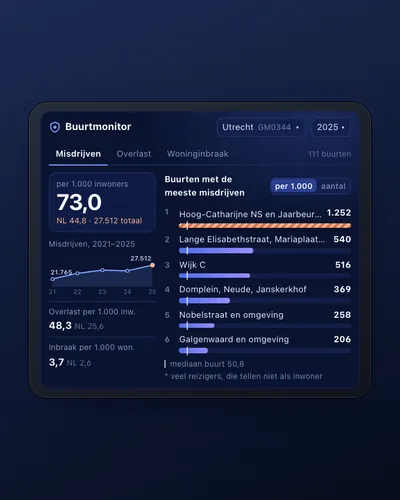 Neighbourhood safety monitor: nuisance and crime per neighbourhoodDashboard
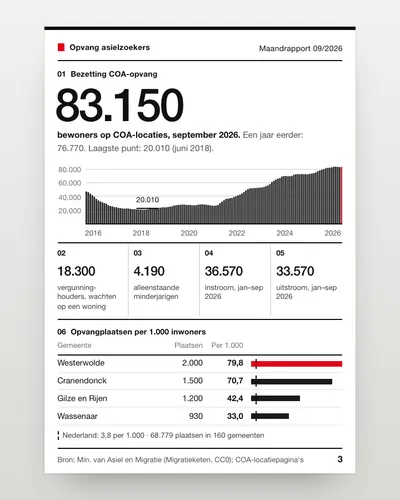 Asylum reception dashboard: national and per municipalityDashboard
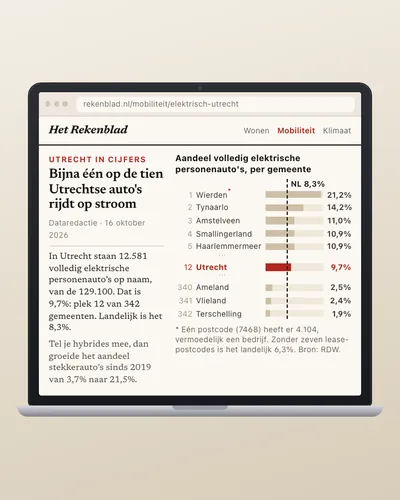 How fast is your municipality going electric?Analysis
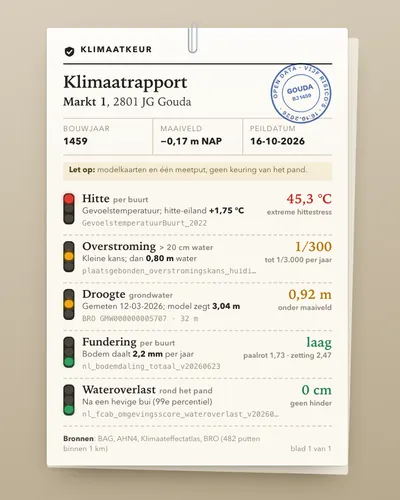 Climate risk check for an addressTool
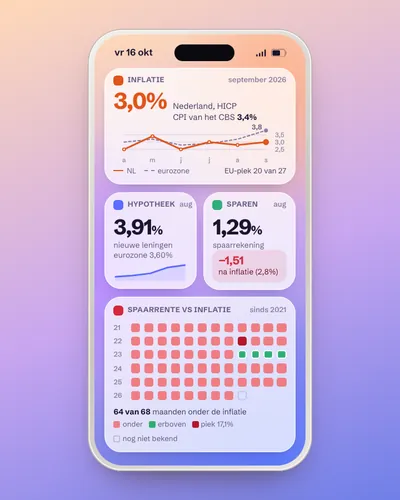 Monitor for inflation, mortgage rates and savings ratesDashboard