A page showing per municipality what share of passenger cars is fully electric, where it ranks among the 342, and how fast it is going nationally, from the daily RDW count per postcode and the CBS annual series.
The Open Data Index MCP server is on in your chat, so the assistant reads this project and its sources itself.
You paste this project's prompt
Build a small web page (Next.js, or one HTML file with a Node 20 script that prepares the data) showing per municipality what share of passenger cars is fully electric and where the municipality ranks.
The assistant fetches from Open Data Index
geef_project("elektrisch-rijden-gemeente")
geef_bron("rdw-voertuigen")
geef_bron("cbs-statline")
The assistant
I have the project, the tested calls and the pitfalls. I'll build a analysis with RDW registered vehicles and CBS StatLine. This is how it could look:
You build this yourself. Copy the prompt into Claude, ChatGPT or Cursor, with the MCP server on, or follow the steps below.
Almost one in ten cars in Utrecht runs on electricity
Data desk · 16 October 2026
Utrecht has 12,581 fully electric passenger cars registered, out of 129,100. That is 9.7%: 12th of 342 municipalities. Nationally it is 8.3%.
Counting hybrids, the share of plug-in cars grew from 3.7% in 2019 to 21.5%.
Share of fully electric passenger cars, by municipality
NL 8.3%
1Wierden*21.2%
2Tynaarlo14.2%
3Amstelveen11.0%
4Smallingerland10.9%
5Haarlemmermeer10.9%
⋯
12Utrecht9.7%
⋯
340Ameland2.5%
341Vlieland2.4%
342Terschelling1.9%
* One postcode (7468) has 4,104 of them, probably a company. Without seven leasing postcodes the national figure is 6.3%. Source: RDW.
Mockup
This is a mockup, not a working version, with the figures from our test run on 16 October 2026 (RDW registrations of that day, CBS for the growth since 2019). Turn the MCP server on with the address on For AI.
Who it's for
Council members and civil servants following the energy transition, local journalists, and anyone who wants to know whether their municipality is ahead or behind.
What you get
A page with a drop-down for the municipality. You see the share of fully electric passenger cars, the rank among all municipalities, the postcodes with the most electric cars (so you can spot company addresses) and a line with national growth since 2019. With the extension (a monthly snapshot) each municipality builds up its own series.
Test run on 16 October 2026: the RDW counted 798,322 fully electric passenger cars out of 9,564,492 (8.3%). Seven postcodes with more than 20,000 cars each (probably leasing and rental) held 223,943 of them; without those postcodes it was 6.3%. Utrecht came out at 12,581 of 129,100 passenger cars (9.7%), rank 12 of 342. Highest: Wierden 21.2%, but one postcode there (7468) has 4,104 electric cars out of 11,505, probably a company. Lowest: Terschelling 1.9%. Nationally, the share of passenger cars with electricity as main fuel (hybrids included, CBS) grew from 3.7% on 1 January 2019 to 21.5% on 1 January 2026.
Electric and hybrid passenger cars: 2.02 million in 2026, 6.4 times as much as in 2019
Electric and hybrid passenger cars, 2019 – 2026, in million. That is the highest point in the series.
Source: CBS, tabel 85237NED (Personenauto's actief; voertuigkenmerken, regio's, 1 januari) · opgehaald 25 oktober 2026 · selection: Bouwjaar: Totaal alle bouwjarenOpen the table Single block
How you could start5 steps
1
Count cars per fuel
The RDW table Brandstoffen_op_PC4 (8wbe-pu7d) counts all vehicles per four-digit postcode, vehicle type and fuel, updated daily. Fuel is a code: B petrol, D diesel, E fully electric, BE petrol plus electric (hybrid, including plug-in), BG petrol plus LPG. SoQL computes on the server: $select with sum(aantal), $where and $group. Numbers come back as text.
The postcode is the keeper's address. Leasing and rental companies have tens of thousands of cars at one address, and many of them electric. Postcode 1114 alone has 59,943 electric passenger cars. Take those postcodes out (in the script: more than 20,000 passenger cars) and show each municipality's largest postcodes, because smaller company addresses also skew the picture.
The RDW has no municipality. CBS table 85236NED (motor vehicles per postcode, 2019 to 2023) has a Gemeentecode_22 column per postcode. That is the 2023 division, padded with spaces (' 363'): trim first, then pad with zeros to 0363. 4,678 postcodes, 89 of them without a municipality. Municipalities merged after 2023 have to be merged by you.
The RDW table is a snapshot without history. For 'how fast' use the CBS series 85237NED: active passenger cars on 1 January, 2019 to 2026, with Bouwjaar 'T001378' (all build years). Mind the definition: at CBS 'Elektriciteit' also includes hybrids (21.5% in 2026), at the RDW E is fully electric only (8.3%). Don't compare those two numbers.
There is no open series of electric cars per municipality. You build it yourself: run the script on the first of every month (cron or GitHub Actions) and store per municipality the number of E and the total with the date. After a year you have twelve points and see which municipalities grow fastest. Keep the raw postcode count too, so you can adjust the lease threshold later.
Put the number of electric cars per municipality next to the number of public charging points from the NDW file (see the project laadpalen-per-buurt).
Let AI build it
Paste this prompt into Claude, ChatGPT, Cursor or Lovable. It names the real endpoints, the join keys and the pitfalls, so the assistant writes working code straight away. Always check the result against the source itself.
Build a small web page (Next.js, or one HTML file with a Node 20 script that prepares the data) showing per municipality what share of passenger cars is fully electric and where the municipality ranks.

Data, open and without a key:
- RDW Brandstoffen_op_PC4 (Socrata SoQL, daily): https://opendata.rdw.nl/resource/8wbe-pu7d.json?$select=postcode,brandstof,sum(aantal) AS n&$where=voertuigsoort='Personenauto'&$group=postcode,brandstof&$limit=50000 (18,164 rows, ~0.9 MB)
- Postcode to municipality (CBS 85236NED, OData v3): https://opendata.cbs.nl/ODataApi/OData/85236NED/TypedDataSet?$format=json&$filter=Perioden eq '2023JJ00' and startswith(RegioS,'PC')&$select=RegioS,Gemeentecode_22
- Municipality names: https://opendata.cbs.nl/ODataApi/OData/85236NED/RegioS?$format=json&$filter=startswith(Key,'GM')
- National series (CBS 85237NED): https://opendata.cbs.nl/ODataApi/OData/85237NED/TypedDataSet?$format=json&$filter=Bouwjaar eq 'T001378'&$select=Perioden,Totaal_14,Elektriciteit_18

What you need to know:
- RDW fuel codes: B petrol, D diesel, E fully electric, BE petrol hybrid, DE diesel hybrid, BG petrol plus LPG. Numbers come as text: convert them.
- The postcode is the keeper's address, including leasing and rental companies (1114: 59,943 electric cars). Exclude postcodes with more than 20,000 passenger cars and show per municipality the three postcodes with the most electric cars, so readers can spot company addresses themselves.
- CBS Gemeentecode_22 is padded with spaces ('   344'): trim and pad with zeros to four digits. It is the 2023 division.
- CBS 'Elektriciteit' includes hybrids; RDW 'E' doesn't. Never present them as the same number.
- CBS sometimes returns 500 or 503: retry with an increasing delay. With Socrata: set $limit high, the default is 1,000 rows.
- Store a monthly snapshot (date, municipality, E, total) in a JSON or SQLite file; that builds a series per municipality.

Output: a drop-down with all municipalities; below it a big percentage (fully electric), 'rank X of 342', a small bar with the national average next to it, the three largest postcodes with their share, and a line chart of the national series 2019 to 2026 (explaining that hybrids are included). A sortable table of all municipalities. At the bottom the reference dates: RDW (date fetched), CBS 1 January 2026, postcode division 2023.
The core of the project in a small script. Needs: Node 20+ (fetch ingebouwd), geen pakketten. Tested on 2026-10-16; below is the real output of that run.
// Hoe elektrisch rijdt jouw gemeente? RDW (auto's per postcode en brandstof, dagelijks) + CBS (postcode -> gemeente,
// landelijke reeks 2019-2026). Node 20+, geen pakketten nodig.
const UA = { "User-Agent": "mijn-ev-monitor/1.0 (+jij@voorbeeld.nl)" };
const GM = "0344";          // Utrecht; jouw gemeentecode
const LEASE = 20000;        // postcodes met meer personenauto's dan dit zijn adressen van lease- en verhuurbedrijven
async function json(url, pogingen = 4) {     // CBS geeft soms een 500 of 503: even wachten en opnieuw
  for (let i = 1; ; i++) { const r = await fetch(url, { headers: UA }); if (r.ok) return r.json();
    if (i >= pogingen) throw new Error(`${r.status} ${url}`); await new Promise((ok) => setTimeout(ok, 10000 * i)); } }
const CBS = "https://opendata.cbs.nl/ODataApi/OData";

// 1. Landelijke reeks: actieve personenauto's op 1 januari (CBS 85237NED). Let op: 'Elektriciteit' telt hybrides mee.
const reeks = (await json(`${CBS}/85237NED/TypedDataSet?$format=json&$filter=Bouwjaar eq 'T001378'&$select=Perioden,Totaal_14,Elektriciteit_18`)).value;
console.log("Nederland, 1 januari, personenauto's met elektriciteit als (hoofd)brandstof, incl. hybrides (CBS):");
console.log("  " + reeks.map((r) => `${r.Perioden.slice(0, 4)} ${(100 * r.Elektriciteit_18 / r.Totaal_14).toFixed(1)}%`).join(", "));

// 2. Postcode -> gemeente (CBS 85236NED, indeling 2023; de code is met spaties aangevuld: '   344')
const pc = (await json(`${CBS}/85236NED/TypedDataSet?$format=json&$filter=Perioden eq '2023JJ00' and startswith(RegioS,'PC')&$select=RegioS,Gemeentecode_22`)).value;
const gemeenteVan = Object.fromEntries(pc.filter((r) => r.Gemeentecode_22?.trim()).map((r) => [r.RegioS.slice(2), r.Gemeentecode_22.trim().padStart(4, "0")]));
const namen = Object.fromEntries((await json(`${CBS}/85236NED/RegioS?$format=json&$filter=startswith(Key,'GM')`)).value.map((r) => [r.Key.slice(2), r.Title]));

// 3. Personenauto's per postcode en brandstof (RDW Brandstoffen_op_PC4). E = volledig elektrisch, BE = benzine-hybride.
const rdw = await json("https://opendata.rdw.nl/resource/8wbe-pu7d.json?$select=postcode,brandstof,sum(aantal) AS n&$where=voertuigsoort='Personenauto'&$group=postcode,brandstof&$limit=50000");
const perPc = {}; for (const r of rdw) { const p = (perPc[r.postcode] ??= { tot: 0, E: 0 }); p.tot += +r.n; if (r.brandstof === "E") p.E += +r.n; }
const lease = Object.entries(perPc).filter(([, p]) => p.tot > LEASE);
const land = Object.values(perPc).reduce((s, p) => ({ tot: s.tot + p.tot, E: s.E + p.E }), { tot: 0, E: 0 });
const zonder = lease.reduce((s, [, p]) => ({ tot: s.tot - p.tot, E: s.E - p.E }), land);
console.log(`\nRDW nu: ${land.E} van ${land.tot} personenauto's volledig elektrisch (${(100 * land.E / land.tot).toFixed(1)}%).`);
console.log(`  ${lease.length} postcodes met meer dan ${LEASE} auto's (vermoedelijk lease en verhuur: ${lease.map(([k]) => k).join(", ")}) hebben ${lease.reduce((s, [, p]) => s + p.E, 0)} elektrische auto's;`);
console.log(`  zonder die postcodes: ${(100 * zonder.E / zonder.tot).toFixed(1)}%`);

// 4. Per gemeente optellen (zonder de lease-postcodes) en rangschikken
const perGm = {};
for (const [p, v] of Object.entries(perPc)) { const g = gemeenteVan[p]; if (!g || v.tot > LEASE) continue;
  const t = (perGm[g] ??= { tot: 0, E: 0, pcs: 0 }); t.tot += v.tot; t.E += v.E; t.pcs++; }
const rang = Object.entries(perGm).map(([g, t]) => ({ g, naam: namen[g] ?? g, ...t, aandeel: t.E / t.tot })).sort((a, b) => b.aandeel - a.aandeel);
const hier = rang.findIndex((r) => r.g === GM), r = rang[hier];
console.log(`\n${r.naam} (GM${GM}): ${r.E} van ${r.tot} personenauto's elektrisch = ${(100 * r.aandeel).toFixed(1)}%, plek ${hier + 1} van ${rang.length} gemeenten (${r.pcs} postcodes)`);
const eigen = Object.entries(perPc).filter(([p]) => gemeenteVan[p] === GM).sort((a, b) => b[1].E - a[1].E).slice(0, 3);
console.log("  meeste elektrische auto's:", eigen.map(([p, v]) => `${p}: ${v.E} van ${v.tot} (${(100 * v.E / v.tot).toFixed(0)}%)`).join(", "));
console.log("Hoogste aandeel:", rang.slice(0, 5).map((x) => `${x.naam} ${(100 * x.aandeel).toFixed(1)}%`).join(", "));
console.log("Laagste aandeel:", rang.slice(-5).map((x) => `${x.naam} ${(100 * x.aandeel).toFixed(1)}%`).join(", "));
const top = Object.entries(perPc).filter(([p]) => gemeenteVan[p] === rang[0].g).sort((a, b) => b[1].E - a[1].E)[0];
console.log(`Controleer de koploper: in ${rang[0].naam} heeft postcode ${top[0]} er ${top[1].E} van ${top[1].tot} (bedrijfsadres?)`);
Output
Nederland, 1 januari, personenauto's met elektriciteit als (hoofd)brandstof, incl. hybrides (CBS):
  2019 3.7%, 2020 4.7%, 2021 6.1%, 2022 8.2%, 2023 10.7%, 2024 13.8%, 2025 17.5%, 2026 21.5%

RDW nu: 798322 van 9564492 personenauto's volledig elektrisch (8.3%).
  7 postcodes met meer dan 20000 auto's (vermoedelijk lease en verhuur: 1114, 1327, 3824, 3991, 4817, 5048, 9723) hebben 223943 elektrische auto's;
  zonder die postcodes: 6.3%

Utrecht (gemeente) (GM0344): 12581 van 129100 personenauto's elektrisch = 9.7%, plek 12 van 342 gemeenten (47 postcodes)
  meeste elektrische auto's: 3521: 1854 van 4001 (46%), 3511: 1817 van 3794 (48%), 3544: 805 van 8957 (9%)
Hoogste aandeel: Wierden 21.2%, Tynaarlo 14.2%, Amstelveen 11.0%, Smallingerland 10.9%, Haarlemmermeer 10.9%
Laagste aandeel: Noardeast-Fryslân 2.8%, Westerwolde 2.8%, Ameland 2.5%, Vlieland 2.4%, Terschelling 1.9%
Controleer de koploper: in Wierden heeft postcode 7468 er 4104 van 11505 (bedrijfsadres?)
Where it goes wrong
Leasing at one address. Seven postcodes together hold 223,943 electric passenger cars, 28% of all electric cars in the Netherlands. Municipalities such as Ouder-Amstel (1114), Almere (1327), Houten (3991), Breda (4817) and Amersfoort (3824) look far more electric than they are without a correction.
Smaller company addresses count too. Wierden comes first because of postcode 7468 (4,104 electric cars out of 11,505). The threshold of 20,000 only catches the largest. Always show which postcodes make up the number.
Two definitions of electric. CBS 85237NED counts hybrids as 'Elektriciteit' (2,023,337 cars on 1 January 2026), RDW code E is fully electric only (798,322 in October 2026). Always say which one you mean.
Spaces in CBS codes. Gemeentecode_22 is ' 344' and the municipality names have 'GM0344'. Without trimming and padding nothing joins, without an error.
No history at the RDW. Brandstoffen_op_PC4 shows only today. To show 'how fast' per municipality you must store it monthly yourself. Don't invent a series by back-calculating earlier years.
Socrata cannot join. The vehicle table (with date of first registration) and the fuel table (with E) are separate; a SoQL JOIN returns 'joins are not supported'. So you can't get electric cars per build year from the RDW in one call.
Take it further
A monthly snapshot per municipality (GitHub Actions with a cron), so after a year you can show each municipality's growth in percentage points.
A map: colour the municipalities (PDOK boundaries) by electric share and add the number of public charging points per electric car (NDW).
Add income: put the electric share per municipality next to average income from the CBS key figures and see how strong the relationship is.
Per postcode in your own city: the same count at postcode level, on a map with the PDOK postcode areas (CBS postcode4), with company addresses in grey.
More with this data
New fully electric passenger cars sold: 156 thousand in 2025, 188 times as much as in 2012
New fully electric passenger cars sold, 2012 – 2025, in thousand. That is the highest point in the series.
Source: CBS, tabel 85898NED (Verkochte wegvoertuigen; nieuw en tweedehands, voertuigsoort, brandstof) · opgehaald 25 oktober 2026Open the table Single block


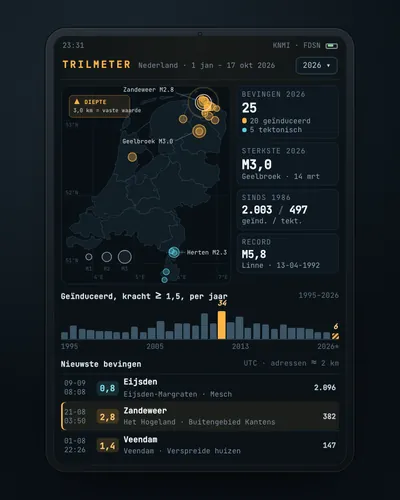 Earthquake tracker: every quake on the map, with municipality and homes
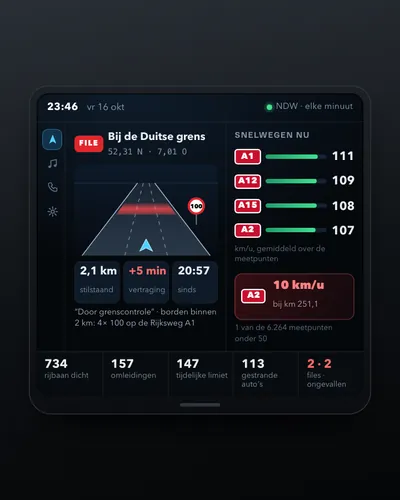 Dashboard of traffic jams, speeds and roadworks
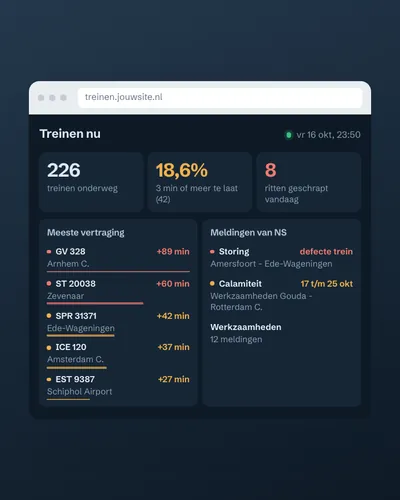 Train delay and disruption dashboard
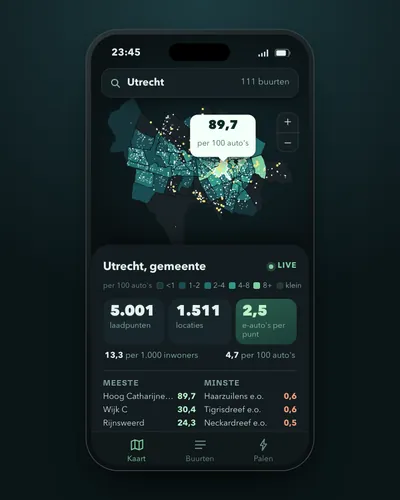 Charging points per neighbourhood and per electric car
 Live map of buses, trams and metros
 Monitor for inflation, mortgage rates and savings rates