Weather app for your own place: warmer, wetter or sunnier than normal?
A small app that picks the nearest KNMI station and tells you how the latest day compares with the same time of year in 1991-2020: in degrees, millimetres and hours of sunshine, and as a percentile.
geef_project("lokale-weer-app")geef_bron("knmi-daggegevens")geef_bron("knmi-dataplatform")
I have the project, the tested calls and the pitfalls. I'll build a app with KNMI daily weather data and KNMI Data Platform. This is how it could look:
You build this yourself. Copy the prompt into Claude, ChatGPT or Cursor, with the MCP server on, or follow the steps below.
(normal 10.2°, daily mean)
- Min
- 5.7°
- Max
- 16.2°
- Warmest hour
- 15.9°15–16 h
This is a mockup, not a working version, with the figures from our test run on 16 October 2026 (KNMI daily data, last complete day 14 October 2026). Turn the MCP server on with the address on For AI.
Who it's for
Anyone who wants to build their own weather widget, a daily bot ("Yesterday Groningen was sunnier than 89% of October days") or a lesson about climate. Also for local media who want to say with every weather report whether it was exceptional.
What you get
A script (and then an app) that finds, for any place in the Netherlands, the nearest weather station that measures temperature, rainfall and sunshine, and compares the latest complete day with the same calendar days (seven days either side) in 1991-2020.
Test run on 16 October 2026 for the Grote Markt in Groningen: station 280 Groningen Airport Eelde (11 km). The latest complete day in the daily data was 14 October 2026. That day averaged 11.6 °C against a normal 10.2 °C (warmer than 64% of the 450 comparable days), it stayed dry against a normal 2.0 mm (49% of those days were dry too) and the sun shone for 8.8 hours against a normal 4.0: sunnier than 89% of those days. The warmest hour was 15.9 °C, from 15:00 to 16:00 Dutch time.
For "right now" you use the KNMI Data Platform: the newest 10-minute file (21:30 UTC) was there at 21:33 UTC, three minutes after the observation.
De Bilt is 1.8 degrees warmer than a century ago: an average of 10.8 °C in 1996–2025, against 8.9 °C in 1901–1930
Annual mean temperature in De Bilt, 1901 – 2025, in °C. The highest point was 2024 (11.8).
How you could start6 steps
- 1
Find the nearest station
There is no separate station-list API, but every response without fmt starts with comment lines giving number, longitude, latitude, altitude and name of each requested station. Ask for stns=ALL for one recent day and compute the distance. Note: on 14 October 2026 that list had 47 stations, but only 34 with a temperature and 32 with temperature, rainfall and sunshine. Buoys and harbours (IJmond 209, Wijdenes 248, Huibertgat 285) often only measure wind. So pick the nearest station that actually has the variables you need.
curl -X POST "https://www.daggegevens.knmi.nl/klimatologie/daggegevens" \
  -d 'stns=ALL&vars=TG&start=20261014&end=20261014'
# STN         LON(east)   LAT(north)  ALT(m)      NAME
# 209         4.518       52.465      0.00        IJmond
# 260         5.180       52.100      1.90        De Bilt
# 280         6.585       53.125      5.20        Groningen Airport Eelde
# 380         5.762       50.906      114.30      Maastricht Airport
# TG        : Etmaalgemiddelde temperatuur (in 0.1 graden Celsius) / Daily mean temperature in (0.1 degrees Celsius)
# STN,YYYYMMDD,   TG
  209,20261014,
  215,20261014,  133
  235,20261014,  142
- 2
Fetch the latest complete day
Request a few days up to today and take the newest one present. On the evening of 16 October 2026 that was 14 October: the daily data lag one or two days, and today is never in it. Values are integers in tenths: TG 116 is 11.6 °C, RH 9 is 0.9 mm, SQ 88 is 8.8 hours of sunshine. RH -1 means less than 0.05 mm, not a missing value.
curl -X POST "https://www.daggegevens.knmi.nl/klimatologie/daggegevens" \
  -d 'stns=280&vars=TG:TN:TX:RH:SQ&start=20261012&end=20261016&fmt=json'
[{"station_code":280,"date":"2026-10-12T00:00:00.000Z","TG":106,"TN":56,"TX":158,"RH":-1,"SQ":89}, {"station_code":280,"date":"2026-10-13T00:00:00.000Z","TG":130,"TN":97,"TX":176,"RH":9,"SQ":0}, {"station_code":280,"date":"2026-10-14T00:00:00.000Z","TG":116,"TN":57,"TX":162,"RH":0,"SQ":88}] - 3
Build the normal from 1991-2020
Fetch thirty years in one request (10,958 days for Eelde, about 700 kB) and store it locally: it no longer changes. For each year take the days within seven days of the same calendar day; that gives 450 comparison days and a more stable normal than a single calendar day (30 values). Handle 29 February and the turn of the year separately. At Eelde RH was -1 on 1,254 days: count it as 0, not as missing.
curl -X POST "https://www.daggegevens.knmi.nl/klimatologie/daggegevens" \
  -d 'stns=280&vars=TG:RH:SQ&start=19910101&end=20201231&fmt=json'
[{"station_code":280,"date":"1991-01-01T00:00:00.000Z","TG":43,"RH":10,"SQ":43}, {"station_code":280,"date":"1991-01-02T00:00:00.000Z","TG":88,"RH":171,"SQ":0}, {"station_code":280,"date":"1991-01-03T00:00:00.000Z","TG":64,"RH":18,"SQ":10}, {"station_code":280,"date":"1991-01-04T00:00:00.000Z","TG":56,"RH":-1,"SQ":53}, ... {"station_code":280,"date":"2020-12-31T00:00:00.000Z","TG":17,"RH":-1,"SQ":0}] - 4
Hour by hour, in Dutch time
For the course of a day use /uurgegevens. Different variables: T (temperature) instead of TG; asking for TG returns HTTP 500 with an HTML page. start and end are YYYYMMDDHH. Hour 1 is 00:00 to 01:00 UTC and hour 24 is 23:00 to 24:00 UTC. Add two hours in summer time, one in winter time: hour 14 on 14 October is 15:00 to 16:00 in the Netherlands. Hourly SQ is in tenths of an hour (10 = sunshine all hour).
curl -X POST "https://www.daggegevens.knmi.nl/klimatologie/uurgegevens" \
  -d 'stns=280&vars=T:RH:SQ&start=2026101413&end=2026101416&fmt=json'
[{"station_code":280,"date":"2026-10-14T00:00:00.000Z","hour":13,"T":155,"RH":0,"SQ":7}, {"station_code":280,"date":"2026-10-14T00:00:00.000Z","hour":14,"T":159,"RH":0,"SQ":10}, {"station_code":280,"date":"2026-10-14T00:00:00.000Z","hour":15,"T":156,"RH":0,"SQ":10}, {"station_code":280,"date":"2026-10-14T00:00:00.000Z","hour":16,"T":142,"RH":0,"SQ":10}] - 5
Today: the 10-minute observations from the KNMI Data Platform
If you also want the weather right now, you need the KNMI Data Platform. Every 10 minutes it gets a NetCDF file with all automatic stations. It requires a key in the Authorization header. Your own key: create an account on developer.dataplatform.knmi.nl, log in, go to the API Catalogue and click "Request an API key" for the Open Data API. Write it down straight away: it is shown only once. It gives you 1,000 requests per hour of your own. The anonymous key on the same site is shared by everyone (50 per minute, 3,000 per hour) and gave us a 429 before. We made one call: the newest two files. Note: the 21:20 file was still updated at 21:33 (lastModified), so a file can change after it appears. Station 280 is called 06280 in these files. Do not ask every 10 minutes whether there is something new: that is what the Notification Service (MQTT) is for.
https://api.dataplatform.knmi.nl/open-data/v1/datasets/10-minute-in-situ-meteorological-observations/versions/1.0/files?maxKeys=2&orderBy=created&sorting=desc
HTTP 200, x-ratelimit-limit: 3000, x-ratelimit-remaining: 1451 (anonieme sleutel, 16-10-2026 21:34 UTC) {"isTruncated": true, "resultCount": 2, "files": [ {"filename": "KMDS__OPER_P___10M_OBS_L2_202610162130.nc", "size": 156247, "created": "2026-10-16T21:33:41+00:00", "lastModified": "2026-10-16T21:34:11+00:00"}, {"filename": "KMDS__OPER_P___10M_OBS_L2_202610162120.nc", "size": 176204, "created": "2026-10-16T21:23:42+00:00", "lastModified": "2026-10-16T21:33:39+00:00"}], "maxResults": 2, "startAfterFilename": "", "nextPageToken": "eyJjcmVhdGVkIjog..."} - 6
Compare and say it in plain words
A difference in degrees means little without spread. So also give the percentile: "warmer than 64% of comparable days". For rainfall an average works poorly (half the days are dry and a few showers pull it up): rather say how many comparable days were dry or had more than 1 mm. Put the source below it: "KNMI, station 280 Groningen Airport Eelde, normal 1991-2020, recent days provisional".
How the sources fit together
- KNMI daily weather dataKNMI Data Platformvia
stationsnummer (280 in de daggegevens, 06280 in de 10-minutenbestanden)The daily data give the normal and the latest complete day without a key; the Data Platform fills the gap of today and yesterday with 10-minute observations from the same station.
Let AI build it
Paste this prompt into Claude, ChatGPT, Cursor or Lovable. It names the real endpoints, the join keys and the pitfalls, so the assistant writes working code straight away. Always check the result against the source itself.
Build a small weather app (a web page with its own server route, or a Python script) that tells you, for a place in the Netherlands, whether the latest day was warmer, wetter or sunnier than normal.

Input: a place name or coordinates (latitude, longitude in WGS84). Output: a card with three lines, for example "Temperature 11.6 °C, normal 10.2 °C: warmer than 64% of comparable days", plus the station, the distance and the date.

Data: KNMI daily data, no key, POST with form fields (not a JSON body):
curl -A "my-project/1.0 (+you@example.com)" -d "stns=280&vars=TG:RH:SQ&start=19910101&end=20201231&fmt=json" https://www.daggegevens.knmi.nl/klimatologie/daggegevens
Hourly values: the same on /klimatologie/uurgegevens with start/end as YYYYMMDDHH and vars=T:RH:SQ.

What you need to know:
- Station list: there is no separate list. A call without fmt (stns=ALL) returns comment lines "# STN LON(east) LAT(north) ALT(m) NAME". Parse them and pick the nearest station that actually has the variables: of the 47 stations, only 32 had temperature, rainfall and sunshine on 14 October 2026. Empty fields in the CSV mean "not measured".
- All values are integers in tenths: TG 116 = 11.6 °C, RH 9 = 0.9 mm, SQ 88 = 8.8 hours. RH -1 = less than 0.05 mm: count as 0, not as missing.
- The daily data lag one or two days. Request the last week and take the newest date that has all three values for your station. Call it "latest complete day" in the app, not "today". Recent days are provisional.
- Normal: 1991-2020, the days within ±7 days of the same calendar day (450 days). Handle the turn of the year (a date in January looks back into December) and 29 February. Cache the thirty years: they do not change.
- Next to the mean give the percentile (share of comparable days that were colder/less sunny). For rainfall: the share of dry days (< 0.1 mm) rather than just the mean.
- Hourly data: hour 1 = 00:00 to 01:00 UTC, hour 24 = 23:00 to 24:00 UTC. Convert to Europe/Amsterdam (summer time +2, winter time +1). Asking for TG on /uurgegevens gives HTTP 500 with an HTML page: there it is called T.
- The date field is always 00:00 UTC of the day ("2026-10-14T00:00:00.000Z"); use only the first ten characters, or the day shifts in a time zone conversion.
- Raw station series, not homogenised. Fine for "how did it compare with normal", not for trends. Put "Source: KNMI, CC BY 4.0" underneath.
- Always set your own User-Agent; fetch in a server route or script, and do not request thirty years again on every page view.

Optional "now": the KNMI Data Platform (api.dataplatform.knmi.nl/open-data/v1/datasets/10-minute-in-situ-meteorological-observations/versions/1.0/files) with your own key in the Authorization header (request it at developer.dataplatform.knmi.nl, API Catalogue, "Request an API key"). List with orderBy=created&sorting=desc&maxKeys=1, get a temporary download link via .../files/<name>/url and read the NetCDF file (xarray or netCDF4). Station numbers there have 06 in front (06280). Read variable names and units from the file's attributes. Keep the key in an environment variable, never in the code or in the browser. Do not poll: use the Notification Service if you want something new every 10 minutes.
Do NOT use: Open-Meteo (its robots.txt disallows everything).
Try it yourself
The core of the project in a small script. Needs: Python 3.10+ en requests. Tested on 2026-10-16; below is the real output of that run.
# Is het bij jou warmer, natter of zonniger dan normaal? Laatste complete dag van het dichtstbijzijnde KNMI-station,
# vergeleken met dezelfde kalenderdagen (±7 dagen) in 1991-2020. Bron: KNMI daggegevens, geen sleutel nodig.
import math, statistics, requests
from datetime import date, datetime, timedelta, timezone
from zoneinfo import ZoneInfo

KNMI = "https://www.daggegevens.knmi.nl/klimatologie"
UA = {"User-Agent": "mijn-project/1.0 (+jij@voorbeeld.nl)"}
PLEK, LAT, LON = "Groningen, Grote Markt", 53.2194, 6.5665   # zet hier je eigen plek

def post(pad, **velden):
    r = requests.post(f"{KNMI}/{pad}", data=velden, headers=UA, timeout=120)
    r.raise_for_status()
    return r

# 1. Stations met coördinaten staan in de kop van het tekstantwoord (zonder fmt). Haal meteen de laatste dagen op.
vandaag = date.today()
tekst = post("daggegevens", stns="ALL", vars="TG:RH:SQ",
             start=f"{vandaag - timedelta(days=6):%Y%m%d}", end=f"{vandaag:%Y%m%d}").text
stations, waarden = {}, {}
for regel in tekst.splitlines():
    delen = regel.lstrip("# ").split()
    if regel.startswith("# ") and len(delen) >= 5 and delen[0].isdigit():          # '# 280  6.585  53.125  5.20  Groningen Airport Eelde'
        stations[int(delen[0])] = (float(delen[1]), float(delen[2]), " ".join(delen[4:]))
    elif not regel.startswith("#") and regel.strip():                                # '  280,20261014,  118,   0,   65'
        stn, dag, tg, rh, sq = [v.strip() for v in regel.split(",")]
        if tg and rh and sq:                                                          # lege velden: station meet het niet
            waarden.setdefault(int(stn), {})[dag] = (int(tg), int(rh), int(sq))

def km(lon, lat):
    return 6371 * math.hypot(math.radians(lon - LON) * math.cos(math.radians(LAT)), math.radians(lat - LAT))

laatste = max(d for w in waarden.values() for d in w)                                # de daggegevens lopen 1 à 2 dagen achter
kandidaten = sorted((km(*stations[s][:2]), s) for s, w in waarden.items() if laatste in w)
afstand, stn = kandidaten[0]
tg, rh, sq = waarden[stn][laatste]
dag = datetime.strptime(laatste, "%Y%m%d").date()
print(f"{PLEK}: dichtstbijzijnde station met temperatuur, neerslag en zon is {stn} {stations[stn][2]} ({afstand:.0f} km)")
print(f"Laatste complete dag: {dag:%d-%m-%Y}\n")

# 2. Dezelfde kalenderdagen (±7) in 1991-2020, in één verzoek (ruim 10.000 dagen).
reeks = post("daggegevens", stns=stn, vars="TG:RH:SQ", start="19910101", end="20201231", fmt="json").json()
def in_venster(d):
    dd = date(2001, int(d[5:7]), int(d[8:10])) if d[5:10] != "02-29" else date(2001, 2, 28)
    verschil = abs((dd - date(2001, dag.month, dag.day)).days)
    return min(verschil, 365 - verschil) <= 7
venster = [x for x in reeks if in_venster(x["date"]) and None not in (x["TG"], x["RH"], x["SQ"])]
t = [x["TG"] / 10 for x in venster]
r = [max(x["RH"], 0) / 10 for x in venster]       # -1 = minder dan 0,05 mm: als 0 tellen
z = [x["SQ"] / 10 for x in venster]
def plek(w, lijst):
    return 100 * sum(v < w for v in lijst) / len(lijst)

print(f"Vergelijking met {len(venster)} dagen rond {dag:%d-%m} in 1991-2020:")
print(f"  temperatuur  {tg/10:5.1f} °C   normaal {statistics.mean(t):5.1f} °C   warmer dan {plek(tg/10, t):.0f}% van die dagen")
print(f"  neerslag     {max(rh,0)/10:5.1f} mm   normaal {statistics.mean(r):5.1f} mm   droog (<0,1 mm) op {100*sum(v < .1 for v in r)/len(r):.0f}% van die dagen")
print(f"  zon          {sq/10:5.1f} uur  normaal {statistics.mean(z):5.1f} uur  zonniger dan {plek(sq/10, z):.0f}% van die dagen")

# 3. Uur voor uur: uur 1 = 00:00-01:00 UTC. Omzetten naar Nederlandse tijd voordat je het toont.
uren = post("uurgegevens", stns=stn, vars="T:RH:SQ", start=f"{laatste}01", end=f"{laatste}24", fmt="json").json()
warmst = max((u for u in uren if u["T"] is not None), key=lambda u: u["T"])
eind = (datetime(dag.year, dag.month, dag.day, tzinfo=timezone.utc) + timedelta(hours=warmst["hour"])).astimezone(ZoneInfo("Europe/Amsterdam"))
print(f"\nWarmste uur: {warmst['T']/10:.1f} °C, van {eind - timedelta(hours=1):%H:%M} tot {eind:%H:%M} Nederlandse tijd (uur {warmst['hour']} in UTC)")
Groningen, Grote Markt: dichtstbijzijnde station met temperatuur, neerslag en zon is 280 Groningen Airport Eelde (11 km)
Laatste complete dag: 14-10-2026

Vergelijking met 450 dagen rond 14-10 in 1991-2020:
  temperatuur   11.6 °C   normaal  10.2 °C   warmer dan 64% van die dagen
  neerslag       0.0 mm   normaal   2.0 mm   droog (<0,1 mm) op 49% van die dagen
  zon            8.8 uur  normaal   4.0 uur  zonniger dan 89% van die dagen

Warmste uur: 15.9 °C, van 15:00 tot 16:00 Nederlandse tijd (uur 14 in UTC)
Where it goes wrong
- Tenths: TG, TN, TX, RH and SQ are integers in tenths of a degree, millimetre or hour. Forget to divide and it was 116 degrees.
- RH -1 is not a missing value but "less than 0.05 mm". At Eelde it occurred 1,254 times in 1991-2020. Drop those days and the normal becomes too wet.
- The nearest station does not always measure what you need: of 47 stations only 32 had temperature, rainfall and sunshine on 14 October 2026. Choose per variable or filter on stations that have everything.
- Today is not in the daily data, and often yesterday isn't either: on the evening of 16 October 2026 the newest day was 14 October, in /uurgegevens too. For today you need the Data Platform with a key.
- Hourly data are in UTC and run from 1 to 24 (hour 1 = 00:00 to 01:00 UTC). Without conversion you place the warmest afternoon two hours too early.
- A wrong variable on the wrong endpoint (TG on /uurgegevens) returns HTTP 500 with an HTML page, not a JSON error. Check the status code before calling .json().
- The Data Platform's anonymous key is shared: x-ratelimit-remaining was 1,451 of 3,000 per hour on our single call, and at another moment it returned 429. Do not build anything lasting on that key.
Take it further
- Daily bot: run the script every morning and only post when a value falls in the top or bottom 10% ("sunniest 14 October since ..."). Then also look up the rank over all years since the station started.
- Month and season summary: add up the deviations per month and show whether this autumn so far is warmer and drier than 1991-2020, with one stripe per day.
- Combine with Luchtmeetnet: put wind speed (FG) next to hourly nitrogen dioxide and show whether calm days bring worse air where you live.
- For a place far from a station: use ERA5 (account needed) or interpolate between the two or three nearest stations, and tell users in the app how far away the station is.
More with this data
Summer days (25 °C or warmer) in De Bilt (KNMI measurements): an average of 29 days a year in 1996–2025, 87% more than in 1901–1930
Summer days (25 °C or warmer) in De Bilt (KNMI measurements), 1901 – 2025, in days a year. The highest point was 1947 (55).
Solar radiation on a flat surface in De Bilt (KNMI measurements): an average of 1,038 kWh per m² a year in 1996–2025, 8% more than in 1958–1987
Solar radiation on a flat surface in De Bilt (KNMI measurements), 1958 – 2025, in kWh per m² a year. That is the highest point in the series.
The sources2

KNMI daily weather dataIn depth
Daily values from over fifty weather stations: temperature, rainfall, sunshine and wind. The De Bilt series starts in 1901.
KNMI Data Platform
KNMI puts its raw and processed data on one platform: 10-minute observations from all weather stations, radar images, HARMONIE weather forecasts, climate series and satellite data. On 16 October 2026 it held 449 datasets, most under CC BY 4.0. You fetch files (NetCDF, HDF5, GRIB) with the Open Data API; it needs a key, but KNMI publishes an anonymous key to try it out.
More to build
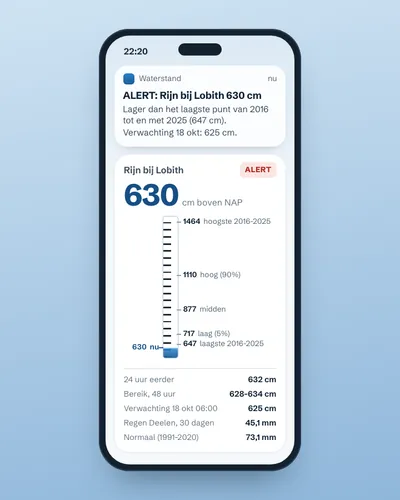 Alert when the river near you is too high or too lowAlert
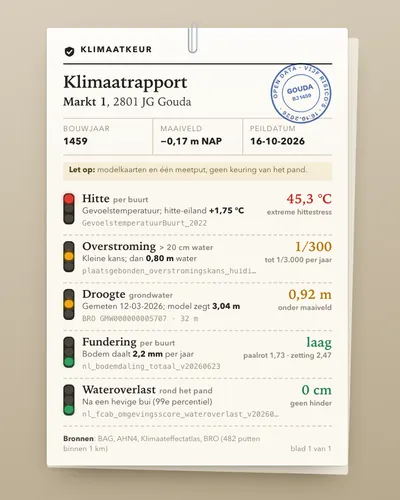 Climate risk check for an addressTool
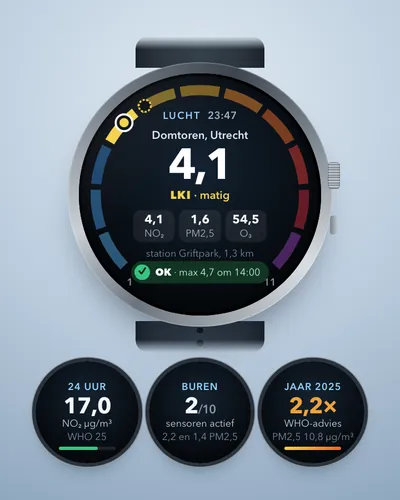 Air quality alert for your own streetAlert
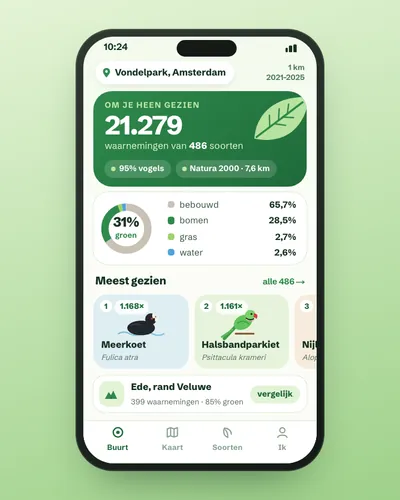 Nature in your neighbourhood: which species were seen and how green is it?App
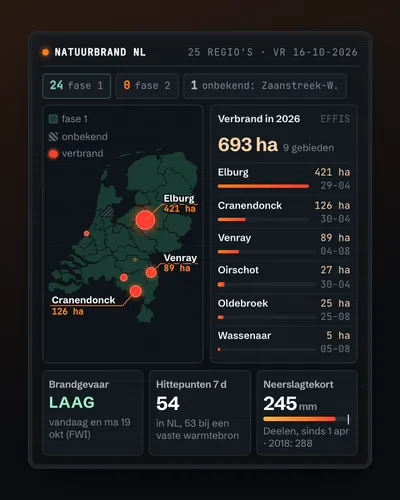 Wildfire map: today's risk, hotspots and burnt landMap
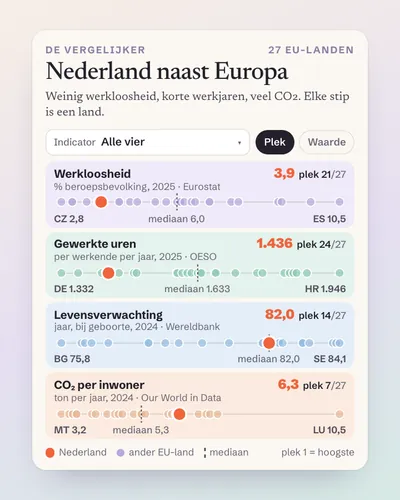 The Netherlands next to Europe: a comparison tool for any indicatorTool