Election map: result, shift and turnout per municipality
A map of all 342 municipalities with the largest party, the gain or loss since the previous election and the turnout, next to income per resident.
geef_project("verkiezingskaart")geef_bron("kiesraad-verkiezingen")geef_bron("pdok-wijkenbuurten")geef_bron("cbs-kwb")
I have the project, the tested calls and the pitfalls. I'll build a map with Election results from the Electoral Council, District and neighbourhood map and Key figures for districts and neighbourhoods. This is how it could look:
You build this yourself. Copy the prompt into Claude, ChatGPT or Cursor, with the MCP server on, or follow the steps below.
Who won where
PVV tops 158 of 342 municipalities
D66 wins the most votes nationally
- 158PVV
- 80D66
- 42VVD
- 38CDA
- 16SGP
- 8GL-PvdA
This is a mockup, not a working version, with the result of the House of Representatives election of 29 October 2025 from our test run on 16 October 2026; we recomputed the map colours on 17 October 2026 from the Electoral Council's municipality CSV. Turn the MCP server on with the address on For AI.
Who it's for
Data journalists and graphics makers on election night and after, political parties and campaign teams, civics teachers and anyone who wants to see where a party grew or shrank.
What you get
A GeoJSON file with all 342 municipalities (2025 boundaries) and per municipality the largest party, the share of D66 and PVV in the general elections of 2023 and 2025, the turnout in 2025 and the average income per resident. Load it straight into MapLibre, Leaflet, QGIS or Datawrapper as a choropleth.
Test run on 16 October 2026 (general election of 29 October 2025): the PVV was largest in 158 municipalities, D66 in 80, VVD in 42, CDA in 38, SGP in 16 and GroenLinks-PvdA in 8, while D66 had the most votes nationally. D66 grew most in Rozendaal (12.7 to 29.1%) and Heemstede (13.2 to 29.5%); the PVV lost most in Edam-Volendam (42.9 to 28.5%) and Bunschoten (33.7 to 21.4%). Turnout was lowest in Rotterdam (63.3%), Heerlen (65.8%) and Almere (67.5%). On Schiermonnikoog more votes were cast than there are voters living there (132.6%). Turnout and income per resident are only weakly related per municipality (r = 0.24 over 337 municipalities).
Votes for the PVV, 2025 general election: highest in Rucphen (46.2%), lowest in Rozendaal (5.1%)
Votes for the PVV, 2025 general election per municipality, October 2025, in percent of valid votes. Netherlands as a whole: 16.7. 342 municipalities with a figure.
How you could start5 steps
- 1
Download the results per municipality
The Electoral Council's database gives a semicolon CSV per election: municipality, code, historical code, party, votes (359 kB for 2025). The election code is type plus date (TK20251029). Code G0518 becomes GM0518 in CBS and PDOK data. G9010 (NBSB, postal voters abroad) is not a municipality: skip codes from G9000. An empty votes column means the party did not stand there.
https://www.verkiezingsuitslagen.nl/uitslag/verkiezing/TK20251029/gemeenten
Gemeente;Code;AmsterdamseCode;Partij;AantalStemmen;AantalZetels;
's-Gravenhage;G0518;11434;D66;49028;;
's-Gravenhage;G0518;11434;GROENLINKS / Partij van de Arbeid (PvdA);40603;;
's-Gravenhage;G0518;11434;PVV (Partij voor de Vrijheid);38897;;
…
Bergen;G0373;11424;VVD;4107;;
…
Bergen;G0893;11281;PVV (Partij voor de Vrijheid);2421;;
…
NBSB;G9010;;GROENLINKS / Partij van de Arbeid (PvdA);25110;;
- 2
The same CSV from the previous election
For the shift, fetch TK20231122. Both years have the same 342 municipality codes. Party names do differ: 'Nieuw Sociaal Contract' in 2023 is 'Nieuw Sociaal Contract (NSC)' in 2025, and BVNL and Nederland met een PLAN got another name. Two municipalities are called 'Bergen' (G0373 in North Holland, G0893 in Limburg): always work with the code.
https://www.verkiezingsuitslagen.nl/uitslag/verkiezing/TK20231122/gemeenten
Gemeente;Code;AmsterdamseCode;Partij;AantalStemmen;AantalZetels;
's-Gravenhage;G0518;11434;PVV (Partij voor de Vrijheid);53202;;
's-Gravenhage;G0518;11434;GROENLINKS / Partij van de Arbeid (PvdA);47315;;
's-Gravenhage;G0518;11434;VVD;36948;;
's-Gravenhage;G0518;11434;DENK;21006;;
's-Gravenhage;G0518;11434;Nieuw Sociaal Contract;20811;;
- 3
Turnout from the CSV zip on data.overheid.nl
The database CSV has no turnout. The Electoral Council also puts a zip per election on data.overheid.nl; the 2025 one (2.3 MB) contains TK2025_uitslag.csv in long format: VeldType says what a row is (Kiesgerechtigden, Opkomst, LijstAantalStemmen …), Waarde the number. Opkomst is the number of votes cast in the municipality, including voters from elsewhere with a voter pass: on Schiermonnikoog 1,050 votes for 792 eligible voters. The README calls it 'research data, not an official election result'.
https://data.overheid.nl/sites/default/files/dataset/a16f3352-c9ce-4831-a314-f989d442a258/resources/Verkiezingsuitslag Tweede Kamer 2025 (CSV Formaat).zip
(zip, 2.299.191 bytes: README_TK2025.txt, TK2025_Stemmen_Per_Lijst_Per_Stembureau.csv, TK2025_uitslag.csv; uit TK2025_uitslag.csv:)
Regio;RegioCode;OuderRegioCode;GrootOuderRegioCode;Partij;LijstNummer;LijstNaam;…;VeldType;Waarde
's-Gravenhage;G0518;K12;P28;;;;;;;;;;;Kiesgerechtigden;357702
's-Gravenhage;G0518;K12;P28;;;;;;;;;;;Opkomst;248100
Bergen (NH);G0373;K11;P27;;;;;;;;;;;Opkomst;20954
Bergen (L);G0893;K19;P31;;;;;;;;;;;Opkomst;8436
Schiermonnikoog;G0088;K2;P21;;;;;;;;;;;Kiesgerechtigden;792
Schiermonnikoog;G0088;K2;P21;;;;;;;;;;;Opkomst;1050
- 4
Municipal boundaries from PDOK
CBS area divisions at PDOK has a generalised municipality map per year: 342 polygons in WGS84, 1.7 MB, light enough for a web map. statcode is the GM code. Use the boundaries of the election year (jaarcode=2025 for October 2025). PDOK's district and neighbourhood map has exact boundaries, but those are much larger.
https://api.pdok.nl/cbs/gebiedsindelingen/ogc/v1/collections/gemeente_gegeneraliseerd/items?f=json&jaarcode=2025&limit=1000
{"type":"FeatureCollection","timeStamp":"2026-10-16T21:59:26Z","links":[{"rel":"self","title":"This document as GeoJSON", …}], "features":[{"type":"Feature","properties":{"einddatum":"2025-12-31T23:59:59Z","id":1,"jaarcode":2025, "jrstatcode":"2025GM0014","rubriek":"gemeente","startdatum":"2025-01-01T00:00:00Z","statcode":"GM0014","statnaam":"Groningen"}, "geometry":{"type":"MultiPolygon","coordinates":[[[[6.741574269507619,53.311599621027824], … … ],"numberReturned":342} - 5
Income per municipality from the district and neighbourhood key figures
Every edition is its own table (2024 = 85984NED, 2025 = 86165NED). Income arrives later: in the 2025 table GemiddeldInkomenPerInwoner_78 is still empty for all municipalities, in the 2024 one filled for 339 of 342 (in 1,000 euros, provisional). The key is padded with spaces to 10 characters: 'GM0518 '. startswith(WijkenEnBuurten,'GM') returns all municipalities at once.
https://opendata.cbs.nl/ODataApi/OData/85984NED/TypedDataSet?$filter=startswith(WijkenEnBuurten,'GM')&$select=WijkenEnBuurten,GemiddeldInkomenPerInwoner_78&$format=json
{
  "odata.metadata":"https://opendata.cbs.nl/ODataApi/OData/85984NED/$metadata#Cbs.OData.WebAPI.TypedDataSet&$select=WijkenEnBuurten,GemiddeldInkomenPerInwoner_78","value":[
    {
      "WijkenEnBuurten":"GM1680    ","GemiddeldInkomenPerInwoner_78":35.0
    },{
      "WijkenEnBuurten":"GM0358    ","GemiddeldInkomenPerInwoner_78":38.1
    }, …
How the sources fit together
- Election results from the Electoral CouncilDistrict and neighbourhood mapvia
gemeentecode: Kiesraad G0518 = PDOK statcode GM0518Replace the G with GM. Use the boundaries of the election year; after a merger old municipalities no longer exist on the map. For the 2023 and 2025 general elections both had the same 342 codes.
- Election results from the Electoral CouncilKey figures for districts and neighbourhoodsvia
gemeentecode: G0518 = WijkenEnBuurten 'GM0518 ' (10 tekens)The district and neighbourhood key figures give residents, age, income, property value and owner-occupied homes per municipality: enough to put results and turnout next to the population. Strip the spaces before joining.
Let AI build it
Paste this prompt into Claude, ChatGPT, Cursor or Lovable. It names the real endpoints, the join keys and the pitfalls, so the assistant writes working code straight away. Always check the result against the source itself.
Build an interactive map (MapLibre GL or Leaflet, a single HTML file, plus a small Node script that prepares the data) of the general elections per municipality: largest party, shift of a chosen party between 2023 and 2025, and turnout.

Data, no keys:
1. Results per municipality (CSV, semicolons): https://www.verkiezingsuitslagen.nl/uitslag/verkiezing/TK20251029/gemeenten and …/TK20231122/gemeenten
   Columns: Gemeente;Code;AmsterdamseCode;Partij;AantalStemmen;AantalZetels. Code G0518 -> GM0518. Skip G9010 (NBSB, postal voters abroad) and all codes from G9000. Empty AantalStemmen = party did not stand. Two municipalities are called 'Bergen' (G0373, G0893): join on code, never on name. Party names differ per year ('Nieuw Sociaal Contract' and 'Nieuw Sociaal Contract (NSC)'): make a small table to align them.
2. Turnout 2025: zip at https://data.overheid.nl/sites/default/files/dataset/a16f3352-c9ce-4831-a314-f989d442a258/resources/Verkiezingsuitslag%20Tweede%20Kamer%202025%20%28CSV%20Formaat%29.zip
   File TK2025_uitslag.csv, long format: column VeldType (Kiesgerechtigden, Opkomst, AantalGeldigeStemmen …), column Waarde. RegioCode G… = municipality, K electoral district, P province, L country, O public body. Turnout% = Opkomst / Kiesgerechtigden. Opkomst also counts voters from elsewhere (voter pass): the Wadden islands go above 100%. Show that with a footnote, not as an error.
3. Boundaries: https://api.pdok.nl/cbs/gebiedsindelingen/ogc/v1/collections/gemeente_gegeneraliseerd/items?f=json&jaarcode=2025&limit=1000 (342 MultiPolygons in WGS84, statcode = GM code).
4. Income per resident: https://opendata.cbs.nl/ODataApi/OData/85984NED/TypedDataSet?$filter=startswith(WijkenEnBuurten,'GM')&$select=WijkenEnBuurten,GemiddeldInkomenPerInwoner_78&$format=json (1,000 euros; keys padded with spaces to 10 characters; 3 municipalities empty). The newer table 86165NED has no income yet.

What the map must do:
- Layer 'largest party': every municipality in the colour of the party with the most votes; legend with the number of municipalities per party.
- Layer 'shift': pick a party; colour by the difference in percentage points between 2023 and 2025 (share of the valid votes for parties in that municipality), diverging colour scale with 0 in the middle.
- Layer 'turnout': 2025 turnout in percent; municipalities above 100% marked separately.
- Click a municipality: top 5 parties 2023 and 2025, turnout, residents and income.
- Small islands and big cities are as large on the map as their area, not their number of voters: put a bar chart or cartogram next to it.

Put the result of steps 1 to 4 in one GeoJSON (properties per municipality) so the web page only has to load that file.
Try it yourself
The core of the project in a small script. Needs: Node 20 of nieuwer (ingebouwde fetch en zlib); draai met: node verkiezingskaart.mjs. Tested on 2026-10-16; below is the real output of that run.
// Verkiezingskaart: winnaar, verschuiving en opkomst per gemeente (Tweede Kamer 2023 en 2025), met grenzen en inkomen.
// Bronnen: Kiesraad (databank-CSV en data.overheid.nl), PDOK (CBS-gebiedsindelingen), CBS Kerncijfers wijken en buurten.
// Geen sleutels. Node 20+. Schrijft verkiezingskaart.geojson (open in QGIS, geojson.io of laad in MapLibre/Leaflet).
import { inflateRawSync } from "node:zlib";
import { writeFileSync } from "node:fs";
const UA = { "User-Agent": "mijn-project/1.0 (+jij@voorbeeld.nl)" };
const tekst = async (url) => (await fetch(url, { headers: UA })).text();

// 1. Stemmen per partij per gemeente uit de databank. Code G0518 -> GM0518. G9010 (briefstemmers buitenland) is geen gemeente.
//    Twee gemeenten heten 'Bergen' (G0373 en G0893): werk altijd met de code, nooit met de naam.
async function uitslag(code) {
  const per = {};
  for (const regel of (await tekst(`https://www.verkiezingsuitslagen.nl/uitslag/verkiezing/${code}/gemeenten`)).trim().split("\n").slice(1)) {
    const [naam, g, , partij, stemmen] = regel.split(";");
    if (!stemmen || +g.slice(1) >= 9000) continue;                       // lege stemmen = partij deed daar niet mee
    const gm = "GM" + g.slice(1);
    const p = partij.replace(/ \(NSC\)$/, "");                            // NSC heet in 2023 en 2025 net anders
    (per[gm] ??= { naam, stemmen: {}, totaal: 0 }).stemmen[p] = +stemmen;
    per[gm].totaal += +stemmen;
  }
  return per;
}
const [tk23, tk25] = await Promise.all([uitslag("TK20231122"), uitslag("TK20251029")]);

// 2. Opkomst 2025: in de CSV-zip op data.overheid.nl (TK2025_uitslag.csv, VeldType Kiesgerechtigden en Opkomst).
//    Zip uitpakken zonder pakket: centrale map lezen, dan het bestand met inflateRaw.
const zip = Buffer.from(await (await fetch("https://data.overheid.nl/sites/default/files/dataset/a16f3352-c9ce-4831-a314-f989d442a258/resources/Verkiezingsuitslag%20Tweede%20Kamer%202025%20%28CSV%20Formaat%29.zip", { headers: UA })).arrayBuffer());
function uitZip(buf, naam) {
  const eocd = buf.lastIndexOf(Buffer.from([0x50, 0x4b, 0x05, 0x06]));
  let p = buf.readUInt32LE(eocd + 16);
  for (let i = 0; i < buf.readUInt16LE(eocd + 10); i++) {
    const [lengte, nl, el, cl, lokaal] = [buf.readUInt32LE(p + 20), buf.readUInt16LE(p + 28), buf.readUInt16LE(p + 30), buf.readUInt16LE(p + 32), buf.readUInt32LE(p + 42)];
    if (buf.toString("utf8", p + 46, p + 46 + nl) === naam) {
      const start = lokaal + 30 + buf.readUInt16LE(lokaal + 26) + buf.readUInt16LE(lokaal + 28);
      return inflateRawSync(buf.subarray(start, start + lengte)).toString("utf8");
    }
    p += 46 + nl + el + cl;
  }
}
const opkomst = {};
for (const regel of uitZip(zip, "TK2025_uitslag.csv").split("\n")) {
  const k = regel.split(";");
  if (!/^G\d{4}$/.test(k[1]) || +k[1].slice(1) >= 9000) continue;
  const o = (opkomst["GM" + k[1].slice(1)] ??= {});
  if (k[14] === "Kiesgerechtigden" || k[14] === "Opkomst") o[k[14]] = +k[15];
}

// 3. Inkomen per inwoner uit de Kerncijfers wijken en buurten 2024 (85984NED; in de tabel van 2025 is inkomen nog leeg).
const kwb = JSON.parse(await tekst("https://opendata.cbs.nl/ODataApi/OData/85984NED/TypedDataSet?" + new URLSearchParams({
  $filter: "startswith(WijkenEnBuurten,'GM')", $select: "WijkenEnBuurten,GemiddeldInkomenPerInwoner_78", $format: "json" }))).value;
const inkomen = Object.fromEntries(kwb.map((r) => [r.WijkenEnBuurten.trim(), r.GemiddeldInkomenPerInwoner_78]));  // sleutel 'GM0518    ' (10 tekens)

// 4. Grenzen 2025 (gegeneraliseerd, 1,7 MB) van PDOK; statcode = GM-code.
const grenzen = JSON.parse(await tekst("https://api.pdok.nl/cbs/gebiedsindelingen/ogc/v1/collections/gemeente_gegeneraliseerd/items?f=json&jaarcode=2025&limit=1000"));

const aandeel = (u, gm, p) => (100 * (u[gm]?.stemmen[p] ?? 0)) / (u[gm]?.totaal || 1);
const winnaars = {}, rijen = [];
for (const f of grenzen.features) {
  const gm = f.properties.statcode, u = tk25[gm];
  if (!u) { console.log("geen uitslag voor", gm); continue; }
  const [winnaar] = Object.entries(u.stemmen).sort((a, b) => b[1] - a[1])[0];
  winnaars[winnaar] = (winnaars[winnaar] ?? 0) + 1;
  const o = opkomst[gm], pct = o ? (100 * o.Opkomst) / o.Kiesgerechtigden : null;
  f.properties = { gm, naam: f.properties.statnaam, winnaar, opkomst: pct && +pct.toFixed(1),
    d66_23: +aandeel(tk23, gm, "D66").toFixed(1), d66_25: +aandeel(tk25, gm, "D66").toFixed(1),
    pvv_23: +aandeel(tk23, gm, "PVV (Partij voor de Vrijheid)").toFixed(1), pvv_25: +aandeel(tk25, gm, "PVV (Partij voor de Vrijheid)").toFixed(1),
    inkomen: inkomen[gm] ?? null };
  rijen.push(f.properties);
}
writeFileSync("verkiezingskaart.geojson", JSON.stringify(grenzen));
console.log(`${rijen.length} gemeenten op de kaart. Grootste partij per gemeente, TK 2025:`);
for (const [p, n] of Object.entries(winnaars).sort((a, b) => b[1] - a[1])) console.log(`  ${String(n).padStart(3)}  ${p}`);
const sorteer = (k) => [...rijen].filter((r) => r[k] != null).sort((a, b) => b[k] - a[k]);
const op = sorteer("opkomst");
console.log(`\nOpkomst: hoogst ${op.slice(0, 3).map((r) => `${r.naam} ${r.opkomst}%`).join(", ")}; laagst ${op.slice(-3).map((r) => `${r.naam} ${r.opkomst}%`).join(", ")}`);
const groei = [...rijen].sort((a, b) => (b.d66_25 - b.d66_23) - (a.d66_25 - a.d66_23));
console.log(`D66 grootste winst: ${groei.slice(0, 3).map((r) => `${r.naam} ${r.d66_23}% -> ${r.d66_25}%`).join(", ")}`);
const pvv = [...rijen].sort((a, b) => (a.pvv_25 - a.pvv_23) - (b.pvv_25 - b.pvv_23));
console.log(`PVV grootste verlies: ${pvv.slice(0, 3).map((r) => `${r.naam} ${r.pvv_23}% -> ${r.pvv_25}%`).join(", ")}`);
// Samenhang opkomst en inkomen (Pearson r). Opkomst boven 100% (stemmers van elders, Waddeneilanden) laten we weg.
const xy = rijen.filter((r) => r.opkomst != null && r.opkomst <= 100 && r.inkomen != null);
const gem = (a) => a.reduce((s, x) => s + x, 0) / a.length;
const mx = gem(xy.map((r) => r.inkomen)), my = gem(xy.map((r) => r.opkomst));
const r = xy.reduce((s, q) => s + (q.inkomen - mx) * (q.opkomst - my), 0) /
  Math.sqrt(xy.reduce((s, q) => s + (q.inkomen - mx) ** 2, 0) * xy.reduce((s, q) => s + (q.opkomst - my) ** 2, 0));
console.log(`Opkomst tegen inkomen per inwoner (${xy.length} gemeenten): r = ${r.toFixed(2)}`);
342 gemeenten op de kaart. Grootste partij per gemeente, TK 2025:
  158  PVV (Partij voor de Vrijheid)
   80  D66
   42  VVD
   38  CDA
   16  Staatkundig Gereformeerde Partij (SGP)
    8  GROENLINKS / Partij van de Arbeid (PvdA)

Opkomst: hoogst Schiermonnikoog 132.6%, Vlieland 112%, Ameland 105.6%; laagst Almere 67.5%, Heerlen 65.8%, Rotterdam 63.3%
D66 grootste winst: Rozendaal 12.7% -> 29.1%, Heemstede 13.2% -> 29.5%, Gooise Meren 12.5% -> 28.1%
PVV grootste verlies: Edam-Volendam 42.9% -> 28.5%, Bunschoten 33.7% -> 21.4%, Westland 32.7% -> 21.2%
Opkomst tegen inkomen per inwoner (337 gemeenten): r = 0.24
Where it goes wrong
- Two municipalities are called 'Bergen' (G0373 North Holland, G0893 Limburg); in the database CSV both appear as 'Bergen', in the zip as 'Bergen (NH)' and 'Bergen (L)'. Always join on code.
- G9010 (NBSB) is not a municipality but the postal voters abroad: 25,110 votes for GroenLinks-PvdA in 2025. Skip codes from G9000, otherwise you have 343 'municipalities' and one without a boundary.
- Turnout above 100% is not an error: Opkomst counts all votes cast in the municipality, including voters from elsewhere with a voter pass. Schiermonnikoog reached 132.6%, Vlieland 112%. Leave those municipalities out of correlations and add a footnote to the map.
- Party names change between elections ('Nieuw Sociaal Contract' became 'Nieuw Sociaal Contract (NSC)'; BVNL and Nederland met een PLAN got another name). If you compare on name, a party disappears and a new one appears.
- Every election has a different file format: the database CSV is per municipality and party, the zip on data.overheid.nl is long (VeldType and Waarde) and older elections have EML and Excel files. Write a separate reader per source and check totals against the national result.
- A map exaggerates sparsely populated municipalities: the PVV was largest in 158 municipalities, but D66 had the most votes nationally. Show the number of voters too (dots, a cartogram or a bar chart).
- The district and neighbourhood key figures are a different table per edition, and income arrives a year or two later than residents. State which table the income comes from (here 85984NED, provisional figures).
Take it further
- Go to polling station level: TK2025_Stemmen_Per_Lijst_Per_Stembureau.csv in the same zip has the postcode per polling station. Link it to PDOK postcodes or neighbourhoods and make a map per district.
- Add the municipal elections of 18 March 2026 (GR20260318): see whether local parties are big where national turnout was low. Note: that CSV is long (VeldType and Waarde) and calls its data provisional.
- Make a time slider through all general elections in the database, on the municipal boundaries of that year (PDOK has area divisions from 2016).
- Put more key figures next to the result (share of over-65s, property value, owner-occupied homes) and show per party which characteristic its share relates to most.
More with this data
Votes for D66, 2025 general election: highest in Heemstede (29.5%), lowest in Urk (0.7%)
Votes for D66, 2025 general election per municipality, October 2025, in percent of valid votes. Netherlands as a whole: 16.9. 342 municipalities with a figure.
The sources3

Election results from the Electoral Council
The official results of all elections: House of Representatives, municipal council, provincial, water board, European Parliament and referendums. The results database goes back to 1848 and has a CSV per municipality for each election. For recent elections data.overheid.nl also has the count files (EML) with votes per polling station and per candidate.

District and neighbourhood map
The official boundaries of all municipalities, districts and neighbourhoods, as a map service (WFS) and download. The geometry you need to map neighbourhood figures.

Key figures for districts and neighbourhoods
Over a hundred figures per neighbourhood: residents by age, households, property values, income, benefits, cars and distance to amenities. A new table every year.
More to build
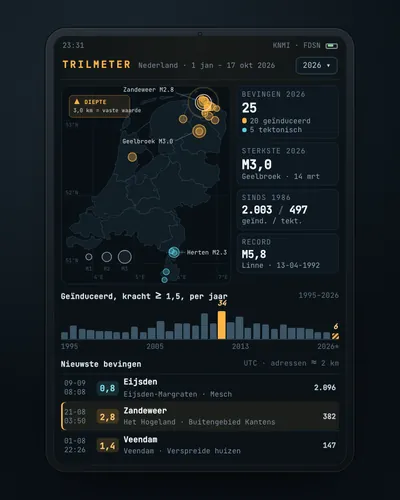 Earthquake tracker: every quake on the map, with municipality and homesMap
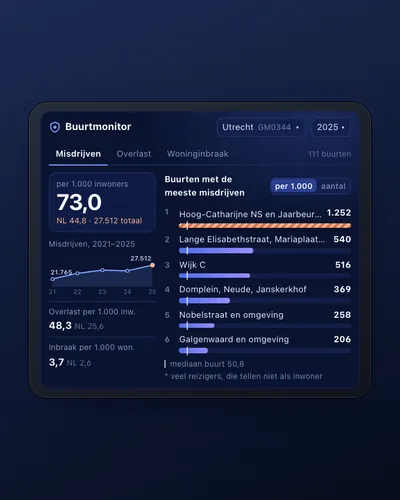 Neighbourhood safety monitor: nuisance and crime per neighbourhoodDashboard
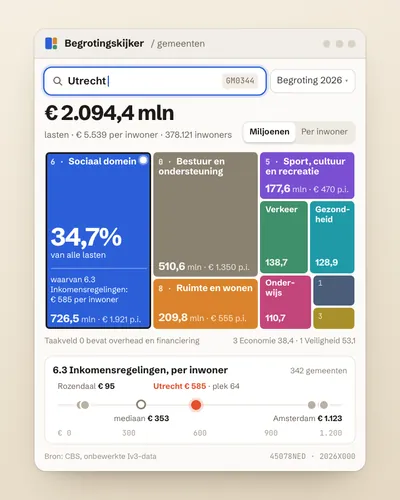 Municipal budget explorer: what does my municipality spend money on?Tool
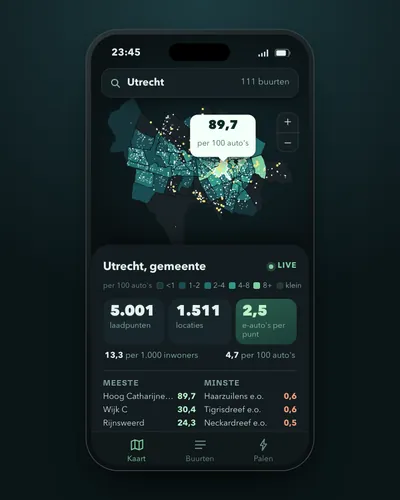 Charging points per neighbourhood and per electric carMap
 Council decision alert: a ping when your municipality decides somethingAlert
 National budget tracker: budgeted against spentDashboard