Healthcare cost comparer per municipality
A tool that shows what basic health insurance spends per resident in your municipality, per type of care, and how that compares with the rest of the Netherlands, also after correcting for age.
geef_project("zorgkosten-vergelijker")geef_bron("vektis-zorgkosten")geef_bron("cbs-kwb")geef_bron("waarstaatjegemeente")
I have the project, the tested calls and the pitfalls. I'll build a tool with Vektis open data on healthcare costs, Key figures for districts and neighbourhoods and Waarstaatjegemeente.nl (municipal benchmark). This is how it could look:
You build this yourself. Copy the prompt into Claude, ChatGPT or Cursor, with the MCP server on, or follow the steps below.
~/zorg $ zorgkosten utrecht --year 2024
✓ vektis 2024 · 12,992 rows · 2.9 MB
✓ 342 of 342 municipalities matched to CBS

UTRECHT GM0344 · 378,121 res.
cost per insured year      € 2,898
rank                       333 of 342 (low cost)
age/sex adjusted           index 102 · rank 74

CARE TYPE         €/YR    LESS MORE
hospital care    1,395  -22%
pharmacy           278  -23%
mental health      374  +61%
nursing            117  -37%
aids                80  -31%
GP other            96   +1%
  difference vs all municipalities

~/zorg $ zorgkosten top 3
HIGHEST           €/YR  IDX  LOWEST       €/YR  IDX
Heerlen          4,520  125  Urk         2,601   96
Landgraaf        4,520  120  Staphorst   2,641   86
Brunssum         4,471  119  Rozendaal   2,700   78
  Netherlands € 3,349 per insured year = 100
~/zorg $
This is a mockup, not a working version, with the figures from our test run on 16 October 2026 with the Vektis file for cost year 2024 (published 20 July 2026). Turn the MCP server on with the address on For AI.
Who it's for
Councillors and policy officers in health and social care, health journalists, public health students, and anyone who wants to know whether 'our municipality is expensive' is really true or just because many older people live there.
What you get
A comparer where you pick a municipality and see: healthcare costs per insured year, its rank among all 342 municipalities, an index after correcting for age and sex (Netherlands = 100) and, per type of care, the difference with all municipalities together.
Test run on 16 October 2026 with the newest file (cost year 2024, published 20 July 2026): - Basic health insurance paid out 59,525 million euros in 2024 for 17,773,377 insured years: 3,349 euros per insured year. - All 342 municipality names matched to a CBS code (2026 boundaries), with two fixed aliases. - Highest costs: Heerlen and Landgraaf (both 4,520 euros per insured year). Lowest: Urk (2,601), Staphorst (2,641) and Rozendaal (2,700). - After correcting for age and sex, Heerlen stays the most expensive (index 125), but Urk comes out at 96: its low costs are mostly because 34% of its insured years are under 20 (nationally 20%). Lowest index: Hilvarenbeek (77) and Rozendaal (78). - Utrecht: 2,898 euros per insured year, rank 333 of 342, so one of the cheapest. After correction Utrecht ranks 74th with index 102: slightly more expensive than you would expect with such a young population. Mental health consultations cost 374 euros per insured year in Utrecht, 61% more than in all municipalities together (233).
Basic health insurance costs per insured person: highest in Heerlen and 1 other municipality (4,520 euros), lowest in Urk (2,601 euros)
Basic health insurance costs per insured person per municipality, 2024, in euros per insured year. Netherlands as a whole: 3,349. 342 municipalities with a figure.
How you could start6 steps
- 1
Find the newest file
Vektis has no API but fixed file names per cost year. Try the path with descending years using a HEAD request: on 16 October 2026, 2025 returned 404 and 2024 returned 200 (2,864,955 bytes, Last-Modified 20 July 2026). According to Vektis the next file arrives mid-2027. Watch the exceptions: 2020 is called ..._versie2.csv and 2011 to 2016 sit in a different folder.
https://www.vektis.nl/vektisnl-assets/prd/storage/uploads/Docs per pagina/Open Data Bestanden/2024/Vektis Open Databestand Zorgverzekeringswet 2024 - gemeente.csv
HTTP/2 200
content-type: text/csv
content-length: 2864955
last-modified: Mon, 20 Jul 2026 12:44:20 GMT
- 2
Read the CSV and set the residual category aside
Semicolon separator, dot as decimal mark, 12,992 data rows: 342 municipalities × 2 sexes × 19 age bands, plus one residual category. That first data row has no sex, age or municipality (412,394 insured people, 220,748.91 insured years): groups smaller than ten and unknown characteristics. Count it in the national total, not in any municipality. There are 26 columns starting with kosten_; the names are truncated at 32 characters (kosten_medisch_specialistische_z).
https://www.vektis.nl/vektisnl-assets/prd/storage/uploads/Docs per pagina/Open Data Bestanden/2024/Vektis Open Databestand Zorgverzekeringswet 2024 - gemeente.csv
geslacht;leeftijdsklasse;gemeentenaam;aantal_bsn;aantal_verzekerdejaren;kosten_medisch_specialistische_z;kosten_farmacie;kosten_huisarts_inschrijftarief;...
;;;412394;220748.91;75738481.61;11107600.71;6081467.62;2120101.39;1852201.82;7886723.95;...
M;0 t/m  4 jaar;AA EN HUNZE;503;462.82;594197.18;32444.9;35500.43;20536.52;15357.5;60736.99;...
M;0 t/m  4 jaar;AALSMEER;731;665.75;1829500.58;55985.58;51112.38;25609.76;17045.38;96918.18;...
- 3
Match the municipality names to CBS codes
The Vektis file only holds the name in capitals ('S GRAVENHAGE', 'NOARDEAST-FRYSLAN', 'BERGEN LB'), no GM code. The 2024 file follows the 2026 municipal boundaries, so take the municipality list from the Key figures for districts and neighbourhoods 2026 (86358NED). Normalise both names (strip accents, punctuation and spaces, upper case). CBS distinguishes equal names with a province ('Bergen (L.)', 'Bergen (NH.)', 'Beek (L.)'): use the name without brackets only when it is unique. Two aliases remain: BERGEN LB = Bergen (L.) and NUENEN CA = Nuenen, Gerwen en Nederwetten. With those, all 342 match.
https://datasets.cbs.nl/odata/v1/CBS/86358NED/WijkenEnBuurtenCodes?$filter=DimensionGroupId eq 'GM'&$select=Identifier,Title
{"@odata.context":"https://datasets.cbs.nl/odata/v1/CBS/86358NED/$metadata#WijkenEnBuurtenCodes(Identifier,Title)","value":[ {"Identifier":"GM1680","Title":"Aa en Hunze"},{"Identifier":"GM0358","Title":"Aalsmeer"}, {"Identifier":"GM0197","Title":"Aalten"},{"Identifier":"GM0059","Title":"Achtkarspelen"}, {"Identifier":"GM0482","Title":"Alblasserdam"},{"Identifier":"GM0613","Title":"Albrandswaard"}, ... - 4
Fetch residents per municipality (for the map and as a check)
Residents on 1 January 2026 is Measure T001036. Use it for the tooltip and as a check, not as the denominator: divide costs by aantal_verzekerdejaren from the Vektis file itself. An insured year reflects how long someone was insured and lived in the municipality (anyone who moves, is born or dies counts partly). Nationally: 17,773,377 insured years in 2024 against 18,130,208 residents on 1 January 2026. We use datasets.cbs.nl (OData v4): codes without padding, CORS open. The old API at opendata.cbs.nl returned 503 on 16 October 2026 around 23:30.
https://datasets.cbs.nl/odata/v1/CBS/86358NED/Observations?$filter=startswith(WijkenEnBuurten,'GM') and Measure eq 'T001036'&$select=WijkenEnBuurten,Value
{"@odata.context":"https://datasets.cbs.nl/odata/v1/CBS/86358NED/$metadata#Observations(WijkenEnBuurten,Value)","value":[ {"Value":26062.0,"WijkenEnBuurten":"GM1680"},{"Value":33459.0,"WijkenEnBuurten":"GM0358"}, {"Value":27608.0,"WijkenEnBuurten":"GM0197"},{"Value":28254.0,"WijkenEnBuurten":"GM0059"}, ... - 5
Calculate per insured year and correct for age and sex
Per municipality, add up all kosten_ columns and divide by insured years. Then compare fairly with indirect standardisation: nationally (without the residual category) compute costs per insured year for every combination of sex and age band (38 cells), multiply by the municipality's insured years in those cells and add up. That is what the municipality 'should' cost. Actual divided by expected times 100 is the index. An 85-year-old costs far more than a 25-year-old: without correction you mostly see where older people live. Don't sort age bands as text: '0 t/m 4 jaar' and '5 t/m 9 jaar' have a double space and the last band is '90+'.
- 6
Waarstaatjegemeente: look, don't automate
The Zorggebruik dashboard on waarstaatjegemeente.nl (VNG) shows comparable municipal figures already processed. The OData API behind it is in beta and only for municipalities (API key, at most 40 municipalities, documentation in a closed Pleio group). We have no key, so we did not test the API. robots.txt disallows /handlers/ and /zoeken and asks for 2 seconds between requests: don't automate the Viewer. What is open: the RSS feed with recent changes, useful to see when new figures arrive. If you work for a municipality, request a key via VNG Realisatie.
https://www.waarstaatjegemeente.nl/feed.ashx
<?xml version="1.0" encoding="utf-8"?><?xml-stylesheet type="text/xsl" href="style/rss.xsl"?><rss xmlns:a10="http://www.w3.org/2005/Atom" version="2.0"><channel>
<title>Waarstaatjegemeente.nl - cijfers en statistieken van gemeenten</title>
<item><category>Link</category><title>Monitor Brede Regeling Combinatiefuncties 2025</title><description />
 <pubDate>Fri, 16 Oct 2026 00:00:00 +0200</pubDate><datum>16-10-2026</datum></item>
<item><category>News</category><title>Waarstaatjegemeente.nl in VNG Magazine: deze maand aandacht voor de Wet open overheid</title> ...
How the sources fit together
- Vektis open data on healthcare costsKey figures for districts and neighbourhoodsvia
gemeentenaam (genormaliseerd) naar GM-code, indeling 2026Vektis only gives the name in capitals. The municipality list of the 2026 Key figures (86358NED) gives the GM code and the number of residents. With the code you can add PDOK municipal boundaries for a map and join other CBS figures, such as income or age profile.
- Vektis open data on healthcare costsWaarstaatjegemeente.nl (municipal benchmark)via
gemeenteWaarstaatjegemeente puts healthcare use next to the social domain (social support, youth care). Use it to check your result and to see which indicators VNG adds itself; for your own tool, get the figures from the original source.
Let AI build it
Paste this prompt into Claude, ChatGPT, Cursor or Lovable. It names the real endpoints, the join keys and the pitfalls, so the assistant writes working code straight away. Always check the result against the source itself.
Build a healthcare cost comparer per municipality: a small Node script that prepares the data, plus one HTML page that shows the result.

Data:
- Vektis open data file on the Health Insurance Act, per municipality (CSV, 2.9 MB):
  https://www.vektis.nl/vektisnl-assets/prd/storage/uploads/Docs%20per%20pagina/Open%20Data%20Bestanden/2024/Vektis%20Open%20Databestand%20Zorgverzekeringswet%202024%20-%20gemeente.csv
  Find the newest year by trying the same path with descending years (HEAD; 2025 returned 404 on 16 Oct 2026).
- CBS Key figures for districts and neighbourhoods 2026 (OData v4, CORS open):
  municipality codes: https://datasets.cbs.nl/odata/v1/CBS/86358NED/WijkenEnBuurtenCodes?$filter=DimensionGroupId eq 'GM'&$select=Identifier,Title
  residents: https://datasets.cbs.nl/odata/v1/CBS/86358NED/Observations?$filter=startswith(WijkenEnBuurten,'GM') and Measure eq 'T001036'&$select=WijkenEnBuurten,Value

The script (Node 20+, fetch) writes a JSON per municipality with: GM code, name, residents, insured years, costs per insured year (total and per cost category), the index after correcting for age and sex, and the rank. The page lets me pick a municipality and shows: costs per insured year with the rank, the index (Netherlands = 100), a bar chart per type of care (municipality against all municipalities together) and the five municipalities closest by index.

Pitfalls:
- The Vektis file sends no CORS header: the browser can't fetch it directly. Prepare it with the script (or a server) and serve the JSON yourself.
- Semicolons, dot as decimal mark, CRLF. 26 columns start with kosten_ (names truncated at 32 characters); add them all up for the total. Columns differ per year (mental health categories new from 2022): read the header, don't use fixed positions.
- The first data row is the residual category (sex, age and municipality empty; 412,394 insured). Count it for the Netherlands, not for any municipality.
- Divide by aantal_verzekerdejaren, not by aantal_bsn and not by residents.
- Municipalities are names in capitals without a code ('S GRAVENHAGE', 'BERGEN NH', 'BERGEN LB', 'NUENEN CA'). Normalise (strip accents, punctuation and spaces) and match to the 2026 CBS list; use the name without brackets only when unique; aliases BERGEN LB = Bergen (L.), NUENEN CA = Nuenen, Gerwen en Nederwetten. Check that all 342 match and report what doesn't.
- Age correction: national costs per insured year per sex x age band (without the residual category), times the municipality's insured years per cell, summed = expected. Index = actual / expected x 100.
- Age bands have double spaces ('0 t/m  4 jaar') and the last one is '90+': turn them into numbers for sorting.
- Costs are claims over eight quarters, negative amounts are corrections, specialist mental health care is about 90% complete. Only what goes through basic insurance: no social support (Wmo), no long-term care (Wlz), no supplementary insurance.
- Vektis terms: non-commercial use only, and put 'source: Vektis' under every chart.

Check: cost year 2024 gives 3,349 euros per insured year for the Netherlands (59,525 million euros, 17,773,377 insured years), Heerlen 4,520 euros with index 125, Utrecht 2,898 euros with index 102 (rank 333 uncorrected, 74 after correction).
Try it yourself
The core of the project in a small script. Needs: Node 20 of nieuwer (ingebouwde fetch), geen pakketten. Opslaan als zorgkosten.mjs en draaien met: node zorgkosten.mjs Utrecht. Tested on 2026-10-16; below is the real output of that run.
// Zorgkosten-vergelijker: kosten van de basisverzekering per verzekerdejaar per gemeente en per zorgsoort,
// met en zonder correctie voor leeftijd en geslacht. Bron: Vektis open databestand Zvw (gemeente, CSV) en
// CBS Kerncijfers wijken en buurten 2026 (86358NED: GM-codes en inwoners, indeling 2026 = indeling van het Vektis-bestand 2024).
// Vektis-voorwaarden: niet-commercieel gebruik, vermeld "bron: Vektis". Draai met: node zorgkosten.mjs [gemeentenaam]
const UA = { "User-Agent": "mijn-zorgkosten/1.0 (+jij@voorbeeld.nl)" };
const VEKTIS = (j) => `https://www.vektis.nl/vektisnl-assets/prd/storage/uploads/Docs%20per%20pagina/Open%20Data%20Bestanden/${j}/Vektis%20Open%20Databestand%20Zorgverzekeringswet%20${j}%20-%20gemeente.csv`;
const KWB = "https://datasets.cbs.nl/odata/v1/CBS/86358NED";
const MIJN = (process.argv[2] ?? "Utrecht").toUpperCase();
const euro = (x) => Math.round(x).toLocaleString("nl-NL");
const norm = (s) => s.normalize("NFD").replace(/[̀-ͯ]/g, "").toUpperCase().replace(/[^A-Z0-9]/g, "");

// 1. Nieuwste kostenjaar: probeer het vaste pad met dalende jaartallen (HEAD). 2025 gaf op 16 okt 2026 nog 404.
let jaar = new Date().getFullYear();
while (!(await fetch(VEKTIS(jaar), { method: "HEAD", headers: UA })).ok) jaar--;
const tekst = await (await fetch(VEKTIS(jaar), { headers: UA })).text();
const regels = tekst.trim().split(/\r?\n/).map((r) => r.split(";"));
const kop = regels[0];
const iG = kop.indexOf("gemeentenaam"), iS = kop.indexOf("geslacht"), iL = kop.indexOf("leeftijdsklasse"), iVj = kop.indexOf("aantal_verzekerdejaren");
const kol = kop.map((k, i) => [k, i]).filter(([k]) => k.startsWith("kosten_"));
console.log(`Vektis ${jaar}: ${regels.length - 1} rijen, ${kol.length} kostenrubrieken, ${(tekst.length / 1e6).toFixed(1)} MB`);

// 2. Optellen. De eerste datarij (geen gemeente, geslacht of leeftijd) is de restcategorie: alleen landelijk meetellen.
const gem = new Map(), cel = new Map(); // cel = landelijk per geslacht x leeftijdsklasse (zonder restcategorie)
let nlEuro = 0, nlVj = 0;
const nlRub = Object.fromEntries(kol.map(([k]) => [k, 0])); // per rubriek, zonder restcategorie
let gemVj = 0;
for (const r of regels.slice(1)) {
  const vj = Number(r[iVj]);
  let tot = 0;
  for (const [k, i] of kol) tot += Number(r[i]) || 0;
  nlEuro += tot; nlVj += vj;
  if (!r[iG]) continue;
  gemVj += vj;
  for (const [k, i] of kol) nlRub[k] += Number(r[i]) || 0;
  const g = gem.get(r[iG]) ?? { euro: 0, vj: 0, rub: {}, cellen: [] };
  g.euro += tot; g.vj += vj; g.cellen.push([r[iS] + r[iL], vj]);
  for (const [k, i] of kol) g.rub[k] = (g.rub[k] ?? 0) + (Number(r[i]) || 0);
  gem.set(r[iG], g);
  const c = cel.get(r[iS] + r[iL]) ?? { euro: 0, vj: 0 };
  c.euro += tot; c.vj += vj; cel.set(r[iS] + r[iL], c);
}
console.log(`Nederland: ${euro(nlEuro / 1e6)} mln euro, ${euro(nlVj)} verzekerdejaren, ${euro(nlEuro / nlVj)} euro per verzekerdejaar (incl. restcategorie)`);

// 3. Correctie voor leeftijd en geslacht: wat zou de gemeente kosten met de landelijke bedragen per geslacht en leeftijdsklasse?
for (const g of gem.values()) {
  const verwacht = g.cellen.reduce((a, [k, vj]) => a + vj * (cel.get(k).euro / cel.get(k).vj), 0);
  g.perVj = g.euro / g.vj;
  g.index = (g.euro / verwacht) * 100;
}

// 4. Koppel de namen (hoofdletters, zonder code) aan CBS-gemeentecodes en inwoners op 1 januari 2026.
const codes = (await (await fetch(`${KWB}/WijkenEnBuurtenCodes?$filter=DimensionGroupId eq 'GM'&$select=Identifier,Title`, { headers: UA })).json()).value;
const inw = Object.fromEntries((await (await fetch(`${KWB}/Observations?$filter=startswith(WijkenEnBuurten,'GM') and Measure eq 'T001036'&$select=WijkenEnBuurten,Value`, { headers: UA })).json()).value.map((o) => [o.WijkenEnBuurten, o.Value]));
const opNaam = new Map(), kaal = new Map();
for (const c of codes) {
  opNaam.set(norm(c.Title), c);
  const k = norm(c.Title.replace(/\s*\(.*\)$/, "")); // "Beek (L.)" -> BEEK, maar alleen als dat uniek is
  kaal.set(k, kaal.has(k) ? null : c);
}
for (const [k, c] of kaal) if (c && !opNaam.has(k)) opNaam.set(k, c);
opNaam.set("BERGENLB", opNaam.get("BERGENL")); // Vektis: BERGEN LB = Bergen (L.)
opNaam.set("NUENENCA", opNaam.get("NUENENGERWENENNEDERWETTEN"));
const mis = [...gem.keys()].filter((n) => !opNaam.get(norm(n)));
for (const [n, g] of gem) g.cbs = opNaam.get(norm(n));
console.log(`Gekoppeld aan CBS: ${gem.size - mis.length} van ${gem.size} gemeenten${mis.length ? ` (niet: ${mis.join(", ")})` : ""}`);

// 5. Ranglijst en jouw gemeente.
const rij = [...gem.entries()].filter(([, g]) => g.cbs);
const rang = (f) => [...rij].sort((a, b) => f(b[1]) - f(a[1])).map(([n]) => n);
const rPer = rang((g) => g.perVj), rIdx = rang((g) => g.index);
const toon = (n) => { const g = gem.get(n); return `${g.cbs.Title.padEnd(26)} ${g.cbs.Identifier} ${euro(g.perVj).padStart(6)} euro/vj  index ${g.index.toFixed(0).padStart(3)}  (${euro(inw[g.cbs.Identifier])} inw.)`; };
console.log("\nHoogste kosten per verzekerdejaar (ongecorrigeerd):"); rPer.slice(0, 3).forEach((n) => console.log("  " + toon(n)));
console.log("Laagste:"); rPer.slice(-3).forEach((n) => console.log("  " + toon(n)));
console.log("Hoogste na correctie voor leeftijd en geslacht (index, Nederland = 100):"); rIdx.slice(0, 3).forEach((n) => console.log("  " + toon(n)));
console.log("Laagste na correctie:"); rIdx.slice(-3).forEach((n) => console.log("  " + toon(n)));

const m = gem.get(MIJN);
console.log(`\n${toon(MIJN)}\n  plaats ${rPer.indexOf(MIJN) + 1} van ${rij.length} ongecorrigeerd, ${rIdx.indexOf(MIJN) + 1} na correctie`);
const naam = (k) => k.replace(/^kosten_/, "").replace(/_/g, " ");
const verschil = kol.map(([k]) => [k, m.rub[k] / m.vj, nlRub[k] / gemVj]).filter(([, , n]) => n > 20).sort((a, b) => b[2] - a[2]).slice(0, 6);
console.log("  Grootste zorgsoorten, euro per verzekerdejaar (gemeente / alle gemeenten samen):");
for (const [k, g, n] of verschil) console.log(`    ${naam(k).padEnd(30)} ${euro(g).padStart(5)} / ${euro(n).padStart(5)}  (${(g / n * 100 - 100 >= 0 ? "+" : "") + (g / n * 100 - 100).toFixed(0)}%)`);
Vektis 2024: 12992 rijen, 26 kostenrubrieken, 2.9 MB
Nederland: 59.525 mln euro, 17.773.377 verzekerdejaren, 3.349 euro per verzekerdejaar (incl. restcategorie)
Gekoppeld aan CBS: 342 van 342 gemeenten

Hoogste kosten per verzekerdejaar (ongecorrigeerd):
  Heerlen                    GM0917  4.520 euro/vj  index 125  (87.764 inw.)
  Landgraaf                  GM0882  4.520 euro/vj  index 120  (36.844 inw.)
  Brunssum                   GM0899  4.471 euro/vj  index 119  (27.474 inw.)
Laagste:
  Rozendaal                  GM0277  2.700 euro/vj  index  78  (1.837 inw.)
  Staphorst                  GM0180  2.641 euro/vj  index  86  (18.219 inw.)
  Urk                        GM0184  2.601 euro/vj  index  96  (22.431 inw.)
Hoogste na correctie voor leeftijd en geslacht (index, Nederland = 100):
  Heerlen                    GM0917  4.520 euro/vj  index 125  (87.764 inw.)
  Landgraaf                  GM0882  4.520 euro/vj  index 120  (36.844 inw.)
  Stadskanaal                GM0037  4.458 euro/vj  index 120  (32.110 inw.)
Laagste na correctie:
  Schiermonnikoog            GM0088  3.255 euro/vj  index  83  (972 inw.)
  Rozendaal                  GM0277  2.700 euro/vj  index  78  (1.837 inw.)
  Hilvarenbeek               GM0798  2.797 euro/vj  index  77  (16.315 inw.)

Utrecht                    GM0344  2.898 euro/vj  index 102  (378.121 inw.)
  plaats 333 van 342 ongecorrigeerd, 74 na correctie
  Grootste zorgsoorten, euro per verzekerdejaar (gemeente / alle gemeenten samen):
    medisch specialistische z      1.395 / 1.777  (-22%)
    farmacie                         278 /   362  (-23%)
    consulten ggz                    374 /   233  (+61%)
    verpleging en verzorging         117 /   184  (-37%)
    hulpmiddelen                      80 /   115  (-31%)
    huisarts overig                   96 /    96  (+1%)
Where it goes wrong
- Without age correction you mostly measure ageing. Urk has the lowest costs per insured year (2,601 euros), but index 96 after correction: 34% of its insured years are under 20. Rozendaal and Hilvarenbeek stay low after correction too (78 and 77). Always show both figures.
- The residual category (first data row, no municipality) belongs to the national total, not to a municipality. Leave it out and the national figure (3,349 euros) is wrong; add it to a municipality and you get a phantom municipality with 75.7 million euros in hospital costs.
- Names in capitals without a code. Match with the 2026 municipal boundaries (the 2024 file uses those), not with 2024's. Two aliases are needed: BERGEN LB and NUENEN CA. Bergen (NH.) and Bergen (L.) are two different municipalities: never match on 'Bergen' alone.
- The CSV has no CORS header: a web page can't fetch it on its own. Process it beforehand (script, build step or your own server) and deliver a small JSON to the browser.
- Columns change per year: 2011 had upper case and full names (KOSTEN_TWEEDELIJNS_GGZ), from 2022 there are three new mental health categories. For a series over years, read the header per year and compare only the total or categories that really mean the same thing.
- Basic insurance only. Social support (Wmo), long-term care (Wlz, nursing homes) and supplementary insurance are not included. A municipality with many people in nursing homes may therefore show low district nursing costs. Call it 'basic insurance healthcare costs', not 'all healthcare costs'.
- Terms: Vektis allows personal use and research only, not commercial, with the credit 'source: Vektis'. A paid app or a company's customer portal doesn't qualify.
Take it further
- Map of the Netherlands with the index per municipality: get the 2026 municipal boundaries from PDOK or use 2025's and report the differences. Colour around 100 with a diverging scale.
- Time series 2017 to 2024 per municipality from the yearly files, only for the total and categories that didn't change name (pharmacy, GP, hospital care). Watch municipal mergers: a 2024 municipality sometimes didn't exist yet in 2017.
- Zoom in with the postcode3 file (21.8 MB, age per year): healthcare costs per postcode area within your municipality. Join with income per postcode (CBS grid statistics) and check whether mental health costs relate to income.
- Put the corrected index next to lifestyle and health per municipality (GGD health monitor, RIVM) or next to the share of low-income residents from the key figures. Say that correlation is not causation.
More with this data
Basic health insurance costs by type of care: most Specialist medical care (31,273 million euros), then Pharmaceuticals and Mental health, consultations
Basic health insurance costs by type of care, 2024, in million euros. Total: 59,525; the largest 12 of 25 categories are shown. Specialist medical care is 53% of the total. Claimed costs under the basic health insurance, including the residual category (groups smaller than ten and unknown characteristics). 17,773,377 insured years.
The sources3

Vektis open data on healthcare costs
What basic health insurance pays out per year, split into 26 cost types such as hospital care, medicines, GP and mental health. Per municipality (age in 5-year bands) and per three-digit postcode area (per year of age), for all insured people. Cost years 2011 to 2024.

Key figures for districts and neighbourhoods
Over a hundred figures per neighbourhood: residents by age, households, property values, income, benefits, cars and distance to amenities. A new table every year.

Waarstaatjegemeente.nl (municipal benchmark)
VNG's data hub on all Dutch municipalities. Figures from public sources and from municipalities themselves, in dashboards on social services, housing, energy, safety, finances and more. In the database you build your own tables and maps and export the figures. The publication calendar lists when each source gets new figures.
More to build
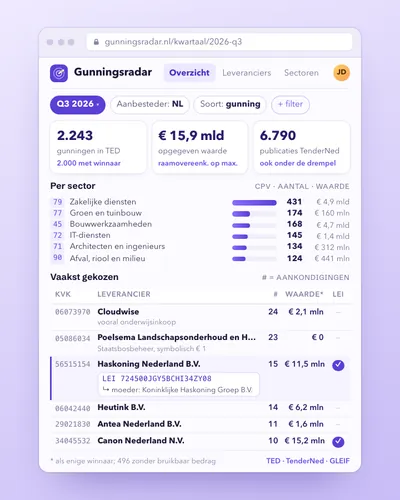 Procurement radar: who wins public contracts?Dashboard
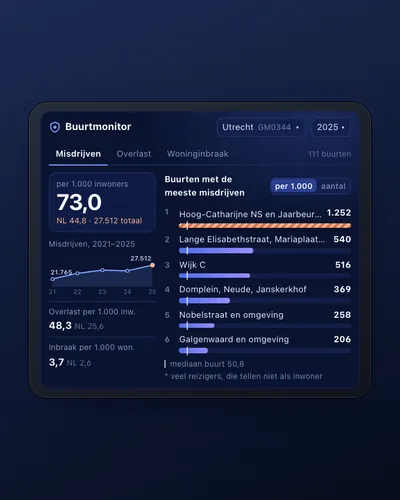 Neighbourhood safety monitor: nuisance and crime per neighbourhoodDashboard
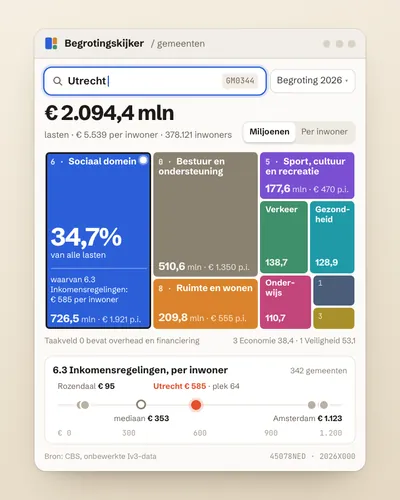 Municipal budget explorer: what does my municipality spend money on?Tool
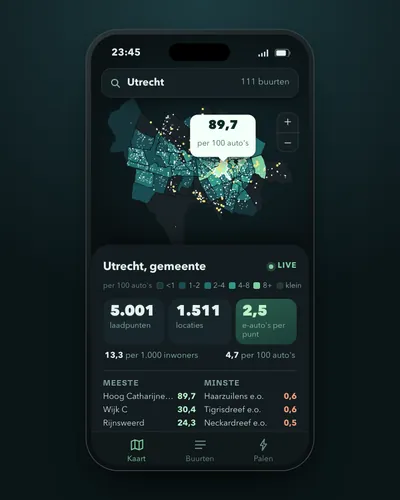 Charging points per neighbourhood and per electric carMap
 Air quality alert for your own streetAlert
 Monitor for inflation, mortgage rates and savings ratesDashboard