
Our World in Data
More than 4,300 charts (16 October 2026; the sitemap lists 5,425, but 1,109 of those are views of 40 multi-dimensional charts) on climate, energy, health, population and prosperity, with explanations. Behind almost every chart is a CSV with the same figures and a description of the source. The Netherlands is almost always included, next to the rest of the world.
Everything that's in it4,321
All Our World in Data charts, in OWID's own areas and topics, fetched every night. A chart can sit under several topics; charts without a topic are listed separately. Every chart has its own page with the CSV for the Netherlands and the metadata (source, unit, last updated).
Education and Knowledge60
Energy and Environment871
Food and Agriculture558
Health1,381
Human Rights and Democracy410
Innovation and Technological Change184
Living Conditions, Community and Wellbeing200
Population and Demographic Change327
Poverty and Economic Development614
Violence and War232
CO₂ emissions per person in the Netherlands: 6.3 tonnes in 2024, 42% less than in 1990
CO₂ emissions per person in the Netherlands, 1990 – 2024, in tonnes. That is the lowest point in the series.
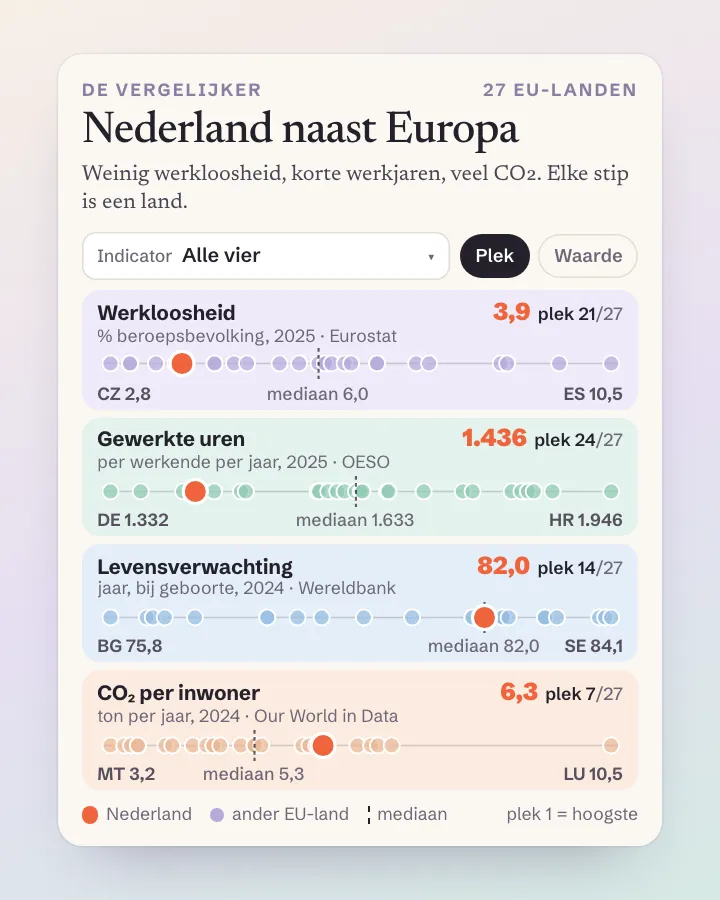
CO₂ emissions per person in the Netherlands: higher than in 20 of the 26 other EU countries
CO₂ emissions per person in 2024, in tonnes per person. Netherlands: 6.3; EU average: 5.4. Highest: Luxembourg (10.5); lowest: Malta (3.2).
What you can build with it1
What can you do with it?4 ideas
CO₂ per Dutch person, since 1846
Fossil CO₂ emissions in the Netherlands peaked in 1979: 13.3 tonnes per person. In 1990 it was 10.8 tonnes, in 2024 6.3 tonnes. Germany was at 6.8 in 2024, Belgium at 7.3 and the world average at 4.7 tonnes.
A quick comparison for an article
Find the chart, select the Netherlands and two neighbours and download the CSV. The source and processing are in the metadata, ready to cite.
A chart that updates itself
Let your own chart read the CSV URL. The nextUpdate field in the metadata says when new figures are due (for CO₂ per person, 13 November 2026).
Back to the original source
Follow the link to the producer in the full metadata (origins), such as the Global Carbon Project. For a fact check you want to know what OWID processed itself.
How to process it4 steps
Take the chart name from the URL
Every chart has a short name: ourworldindata.org/grapher/co-emissions-per-capita. Add .csv for the figures, .metadata.json for the description or .zip for both with a readme.
Filter on the Netherlands
With csvType=filtered and country=~NLD you get only the Netherlands. Separate more countries with a tilde: NLD~DEU~BEL. Use time=2024 or time=1990..2024 to pick the years.
https://ourworldindata.org/grapher/co-emissions-per-capita.csv?v=1&csvType=filtered&useColumnShortNames=true&country=~NLD
Read unit and source from the metadata
The columns section holds unit (t/person), timespan, lastUpdated, nextUpdate and the citation. fullMetadata points to the full description with the licence per original source.
https://ourworldindata.org/grapher/co-emissions-per-capita.metadata.json?v=1&csvType=filtered&useColumnShortNames=true&country=~NLD
Read the Chart API documentation
All parameters are in OWID's documentation.
https://docs.owid.io/projects/etl/api/chart-api/
Interesting combinations

Similar sources
 World Bank indicators
More indicators in one fixed API, but without explanations and curated sources.
 Eurostat
Official European statistics with regional detail, Europe only.
 OECD Data Explorer
The raw OECD tables, often one of the sources behind OWID charts.
What to watch out for
- Mostly not their own data
Most figures come from third parties (WHO, UN, World Bank, Global Carbon Project …). Those fall under that source's licence. Check it before publishing.
- Processed figures
OWID often recalculates, e.g. per person using its own population series. The citation then says 'with major processing by Our World in Data'. Mention that in your own citation too.
- The scope is in the small print
CO₂ per person, for example, excludes land use and international aviation and shipping, and counts what is emitted within the borders (not what we import). Read descriptionKey in the metadata.
- Watch the nonRedistributable field
The full metadata of every series has a nonRedistributable field. Check it before you pass on or republish third-party figures.
APIREST (CSV en JSON), Chart API · read 16 Oct 2026
No key or account needed tested
charts (sitemap 5,425 addresses, 1,109 of which are views of 40 charts; 16 Oct 2026) tested
csvjsonzip
Base URL
https://ourworldindata.org/grapher
Endpoints 7
- GET
/{grafiek}.csvThe figures behind a chart: Entity, Code (ISO3 or OWID_…), Year, and a column per series. The chart name is in the URL on the site. - GET
/{grafiek}.metadata.jsonPer column unit, timespan, lastUpdated, nextUpdate, explanation (descriptionKey, descriptionProcessing), citation and a link to the full metadata. - GET
/{grafiek}.zipCSV, metadata and a readme in one ZIP (CO₂ per capita, NL only: 7.6 kB). - GET
/{grafiek}.config.jsonThe chart settings: title, default country selection, map, dimensions (which indicator ids). - GET
https://api.ourworldindata.org/v1/indicators/{id}.metadata.jsonFull metadata of one indicator: origins (producer, licence, link), nonRedistributable, updatePeriodDays, processingLevel. - GET
https://api.ourworldindata.org/v1/indicators/{id}.data.jsonAll values of one indicator as three lists: values, years, entities (entity ids, not ISO codes). CO₂ per capita: 26,509 values, 580 kB. - GET
https://ourworldindata.org/sitemap.xmlAll chart addresses (/grapher/…); OWID has no public list API for charts.
Filtering tested
No query language: pick the chart in the path, countries with country (~ between) and years with time (.. for a range).
Parameters 6
csvType | full (all countries and years, default) or filtered (only what country and time select). | tested |
country | Countries separated by ~: NLD~DEU~BEL, or ~NLD for one country. Also OWID_WRL (world), OWID_EU27 and names (Netherlands). | tested |
time | 2024, 1990..2024 or latest. | tested |
useColumnShortNames | true gives short column names (entity, code, year, emissions_total_per_capita) instead of titles with characters like ₂. | tested |
v | Chart version (v=1), as in the site's download links. | from the description |
dimensies (bv. metric, source, frequency) | For multi-dimensional charts you pick the view with its own parameters, e.g. electricity-mix.csv?metric=share_of_generation&source=renewables&frequency=annual. | tested |
Columns in the CSV (useColumnShortNames=true) and fields in metadata.json 8
| Name | Type | Meaning |
|---|---|---|
entity | tekst | Land of gebied (Netherlands, World, European Union (27)) |
code | tekst | ISO3 (NLD) of OWID_-code (OWID_WRL, OWID_EU27); leeg bij sommige historische gebieden |
year | integer | Jaar (bij sommige grafieken day) |
emissions_total_per_capita | getal · ton CO₂ per inwoner | Voorbeeldkolom van co-emissions-per-capita; elke grafiek heeft eigen kolommen |
columns.<kolom>.unit / shortUnit | tekst | Eenheid (metadata.json) |
columns.<kolom>.lastUpdated / nextUpdate | datum | Laatste en volgende update van de reeks (metadata.json) |
columns.<kolom>.citationShort | tekst | Bronvermelding om over te nemen |
columns.<kolom>.fullMetadata | url | Link naar de volledige metadata (api.ourworldindata.org) |
Limits and pitfalls
- No key, no documented request limit. Responses come via Cloudflare (cached). csvType=full is 800 kB for CO₂ per capita (26,509 rows); filter instead. tested
- Old chart names redirect (301) to a multi-dimensional chart and then lose the country filter: share-electricity-renewables.csv?country=~NLD returned all countries after the redirect. Catch redirects (curl without -L, fetch with redirect: 'manual') and use the new name with its dimensions. tested
- An unknown country code gives no error, just a header row, which then lacks the Code column. An unknown chart: 404 with {"status":404,"error":"Not found"}. tested
- The CSV's Last-Modified header is the generation time, not freshness. Use lastUpdated and nextUpdate from the metadata (CO₂ per capita: 2025-11-13, next 2026-11-13). tested
- Check nonRedistributable and origins[].license in the full metadata before republishing third-party figures. For CO₂ per capita: false, Global Carbon Project CC BY 4.0. tested
- For charts that open as a map, country=~NLD only works with &tab=chart added. experience
- robots.txt of ourworldindata.org allows everything; api.ourworldindata.org has no robots.txt (404). tested
Try it HTTP 200 · 536 ms · 16 Oct
https://ourworldindata.org/grapher/co-emissions-per-capita.csv?v=1&csvType=filtered&useColumnShortNames=true&country=NLD~DEU~BEL~OWID_WRL&time=2020..2024
entity,code,year,emissions_total_per_capita
Belgium,BEL,2020,7.9076037
Belgium,BEL,2021,8.204076
Belgium,BEL,2022,7.6375527
Belgium,BEL,2023,7.2316356
Belgium,BEL,2024,7.2798314
Germany,DEU,2020,7.738692
Germany,DEU,2021,8.100614
Germany,DEU,2022,7.942359
Germany,DEU,2023,7.022808
Germany,DEU,2024,6.7688236
Netherlands,NLD,2020,7.7664127
Netherlands,NLD,2021,7.889522
Netherlands,NLD,2022,7.1213217
Netherlands,NLD,2023,6.4676642
Netherlands,NLD,2024,6.29691
World,OWID_WRL,2020,4.4577436
World,OWID_WRL,2021,4.634748
World,OWID_WRL,2022,4.6784525
World,OWID_WRL,2023,4.707772
World,OWID_WRL,2024,4.729075
Shortened response, saved at harvest time. Click the URL for the real, current response.
Read from OWID: Chart API (csv, metadata.json, zip; parameters csvType, country, time, useColumnShortNames). Labels: from the description stated in what the api itself publishes. tested from our own small call. platform applies to every api on this platform, per its documentation. experience learned while building open data index.
How to fetch it
curl "https://ourworldindata.org/grapher/co-emissions-per-capita.csv?v=1&csvType=filtered&useColumnShortNames=true&country=NLD~DEU~BEL~OWID_WRL&time=2024"
More from Our World in Data in our index
4,321 datasets in Our World in Data. These changed most recently.
- Constitutional protections against discrimination based on sexual orientation or gender identity2026-10-30
- Gender marker can be legally changed2026-10-29
- Countries by legal status of same-sex marriage2026-10-29
- Countries in which third gender is recognized2026-10-29
- Internally displaced people due to conflict2026-10-29
- Marriage for same-sex partners2026-10-29
More in this topic




See how this page is built
bron: our-world-in-data
blokken: []
secties:
  - ideeen
  - verwerken
  - koppelingen
  - vergelijkbaar
  - beperkingen
  - code
cache:
  tag: bron:our-world-in-data
  ververs: na statuscheck, als de bron nieuwer is
statuscheck:
  methode: veld lastUpdated in de metadata van de grafiek CO₂ per inwoner
  verwacht: jaarlijks
Source: content/bronnen/our-world-in-data.yaml · Markdown